The following graph shows the marginal and average product curves for labor,the firm's only variable input.The monthly wage for labor is $2,800.Fixed cost is $160,000. 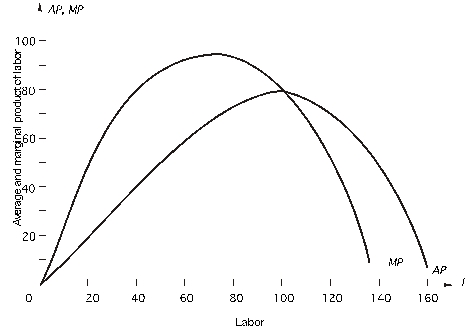 When the firm uses 40 units of labor,what is average total cost at this output?
Definitions:
Hot Dogs
A cooked sausage, traditionally grilled or steamed, served in a sliced bun as a common American street food.
Oil Imports
The purchase of foreign oil by a country to meet its energy needs not covered by domestic production.
Dumping
The practice of selling a product in a foreign market at a price below its cost of production or below the price in the home market, often to gain market share or dispose of surplus.
International Market
A broad term encompassing all commercial transactions that occur between countries, including trade, investment, and currency exchange.
Q5: If the price of labor is $5
Q7: Over the past 25 years,which of the
Q10: Two events occur simultaneously in the market
Q14: Good Z is produced and sold in
Q17: The manager of Greene Enterprises,Inc.,recently estimated
Q19: If the p-value is 10%,then the<br>A)level of
Q36: Use the following demand and supply
Q64: Along an indifference curve<br>A)the MRS is constant.<br>B)the
Q72: Given the table below,what is average
Q84: In the following graph,the price of capital