The following graph shows the marginal and average product curves for labor,the firm's only variable input.The monthly wage for labor is $2,800.Fixed cost is $160,000. 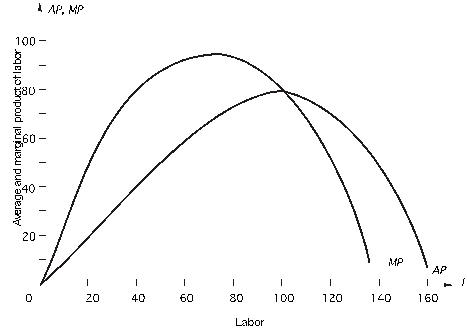 When the firm uses 120 units of labor,what is average total cost at this output?
Definitions:
Entrepreneurship
The process of designing, launching, and running a new business or enterprise, particularly one that is characterized by innovation and risk.
Physical Facilities
The buildings, spaces, and related equipment owned or leased by an organization to support its operations.
Capital
Financial resources or assets owned by an individual or organization, used for investment, production, or other economic purposes.
Tax Deduction
An expense that can be subtracted from an individual's or organization's taxable income, effectively reducing the amount of taxes owed.
Q12: Which of the following represents a
Q17: input prices increase,all else equal,<br>A)quantity supplied will
Q21: Which of the following is true of
Q35: Seasonal or cyclical variation in a time
Q41: the figure below,which shows a linear demand
Q41: Total cost schedule for a competitive
Q46: A manager in charge of new
Q67: Rusal believed the price of aluminum would
Q86: A restaurant hires cooks and waiters.Cooks
Q87: A radio manufacturer is experiencing theft