Multiple Choice
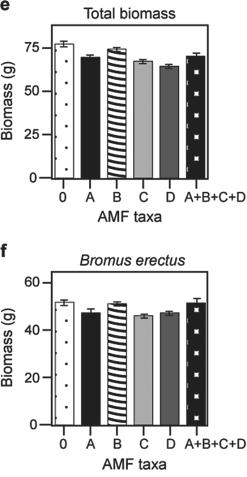 Figure 29.5
-Based on graphs e) and f) in Figure 29.5, which is the most well- supported prediction for the effect on total plant biomass if AMF diversity were increased to eight species?
Definitions:
Related Questions
Q1: What characteristic of short tandem repeats STRs)
Q10: In the pressure- flow mechanism, loading of
Q11: You discover a chemical that inhibits the
Q13: Cloning of plants from cuttings demonstrates that<br>A)
Q13: You have a bush in your yard
Q19: Which one of these mollusc groups can
Q27: The text describes four ways, or tactics,
Q27: Why is nitrogen fixation an essential process?<br>A)
Q40: Which evolutionary innovation was most significant in
Q41: Angiosperms are unique in having double fertilization