TABLE 16-5
A contractor developed a multiplicative time-series model to forecast the number of contracts in future quarters, using quarterly data on number of contracts during the 3-year period from 2006 to 2008. The following is the resulting regression equation:

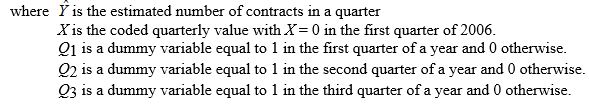
-Referring to Table 16-5, using the regression equation, which of the following values is the best forecast for the number of contracts in the third quarter of 2009?
Definitions:
Gross Margin
A company's total sales revenue minus its cost of goods sold (COGS), divided by total sales revenue, expressed as a percentage.
Fixed Costs
Expenses that do not change with the level of goods or services produced by a business, such as rent, salaries, and insurance premiums.
Sales Increase
A rise in the number of products or services sold, often indicating a growth in a company's business activities and revenue.
Risk/Reward Tolerance
An individual's or entity’s capacity to assume risk with the expectation of receiving a corresponding return, balancing between potential gains and losses.
Q29: Referring to Table 15-5, which of the
Q31: An airline wants to select a computer
Q41: Referring to Table 16-7, the number of
Q45: Data on the amount of money made
Q46: Referring to Table 16-5, the best interpretation
Q58: Referring to Table 16-6, a centered 3-year
Q61: Referring to Table 16-7, the number of
Q75: Referring to Table 17-3, suppose the analyst
Q101: The following is the list of MAD
Q137: Referring to Table 14-15, which of the