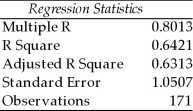
TABLE 15-5
What are the factors that determine the acceleration time (in sec.) from 0 to 60 miles per hour of a car? Data on the following variables for 171 different vehicle models were collected:
Accel Time: Acceleration time in sec.
Cargo Vol: Cargo volume in cu. ft.
HP: Horsepower
MPG: Miles per gallon
SUV: 1 if the vehicle model is an SUV with Coupe as the base when SUV and Sedan are both 0
Sedan: 1 if the vehicle model is a sedan with Coupe as the base when SUV and Sedan are both 0
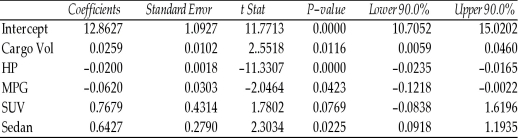
The regression results using acceleration time as the dependent variable and the remaining variables as the independent variables are presented below.
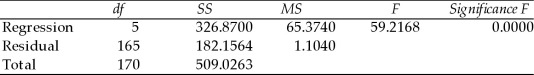
 ANOVA
ANOVA
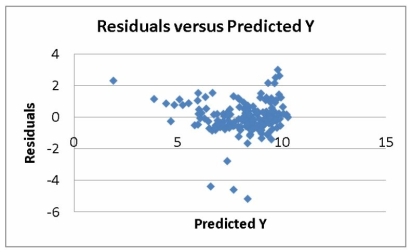
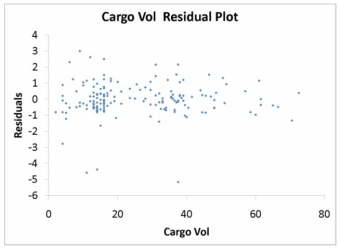
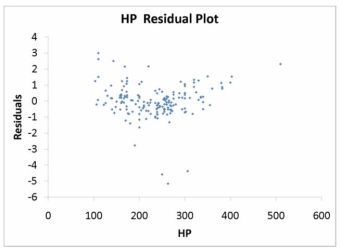
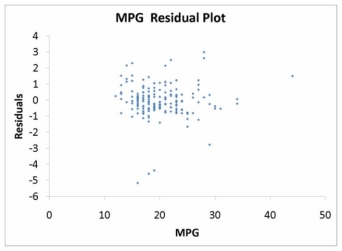
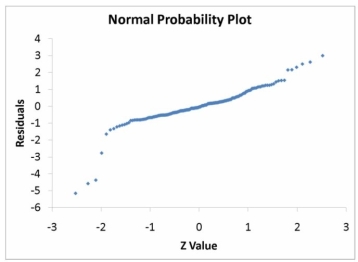
 The various residual plots are as shown below.
 The coefficient of partial determination (
  ) of each of the 5 predictors are, respectively, 0.0380, 0.4376, 0.0248, 0.0188, and 0.0312.
The coefficient of multiple determination for the regression model using each of the 5 variables as the dependent variable and all other X variables as independent variables (  ) are, respectively, 0.7461, 0.5676, 0.6764, 0.8582, 0.6632.
-Referring to Table 15-5, what is the correct interpretation for the estimated coefficient for Cargo Vol?
Definitions:
Sale of Property
The act of transferring ownership of real estate or personal property from one entity to another, often resulting in capital gains or losses for tax purposes.
Personal Residence
A dwelling in which an individual lives for a significant part of the year, considered as their main place of residence.
Working Condition Fringes
These are non-taxable benefits provided by an employer for the benefit of the employee, related directly to the nature of the job.
Professional Organization Dues
Membership fees paid to belong to an organization related to one's professional field, which may be tax-deductible.
Q29: Referring to Table 13-5, the partner wants
Q33: Referring to Table 13-8, the interpretation of
Q35: Referring to Table 17-4, what is the
Q38: Referring to Table 13-11, what are, respectively,
Q46: Changes in the system to reduce common
Q49: If we wish to determine whether there
Q55: Referring to Table 15-4, there is reason
Q115: Referring to Table 17-3, suppose the analyst
Q142: Referring to Table 12-6, the null hypothesis
Q160: Referring to Table 14-4, which of the