TABLE 9-1
Microsoft Excel was used on a set of data involving the number of defective items found in a random sample of 46 cases of light bulbs produced during a morning shift at a plant. A manager wants to know if the mean number of defective bulbs per case is greater than 20 during the morning shift. She will make her decision using a test with a level of significance of 0.10. The following information was extracted from the Microsoft Excel output for the sample of 46 cases:
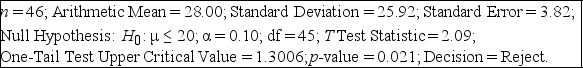
-Referring to Table 9-1, the null hypothesis would be rejected if a 5% probability of committing a Type I error is allowed.
Definitions:
Relationships Between Parts
The way in which components or elements of a system interact with each other to form a cohesive whole.
Degree of Complexity
A metric that quantifies the intricacy and difficulty of a project or system, often considering variables like size, diversity, and interdependencies.
Additive Rule
A principle in probability that states the total probability of the union of mutually exclusive events is equal to the sum of their individual probabilities.
Intersection
An operation in set theory whereby only the elements that are common to all sets are included in the outcome.
Q9: Referring to Table 12-9, the expected cell
Q27: We have created a 95% confidence interval
Q27: Suppose a 95% confidence interval for μ
Q34: "What conclusions and interpretations can you reach
Q36: Referring to Table 9-7, the company officials
Q72: Referring to Table 12-9, there is sufficient
Q84: Referring to Table 11-5, interpret the test
Q108: A major department store chain is interested
Q110: In testing for the differences between the
Q121: Referring to Table 12-14, the perfume manufacturer