The diagram below shows the market demand curve and the cost curves for a single firm.
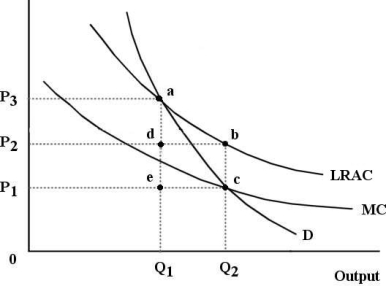 FIGURE 12- 6
-Refer to Figure 12- 6.Suppose this firm is being regulated using a policy of average- cost pricing.In this case,
Definitions:
Straight-Line Basis
A method of calculating depreciation or amortization by evenly allocating the cost of an asset over its useful life.
Salvage Value
The estimated value remaining in an asset after it has served its purpose.
Depreciation Expense
The systematic allocation of the cost of a tangible asset over its useful life, reflecting its consumption, wear and tear, or obsolescence.
Useful Life
The estimated time period that an asset is expected to be usable, contributing to the revenue-generating activities of a business.
Q11: A monopolistically competitive firm and a monopoly
Q76: A single- price monopolist is currently producing
Q81: A policy that puts a price on
Q84: Refer to Figure 12- 6.Suppose this firm
Q89: Refer to Figure 11- 2.In diagram B,the
Q100: With regard to the "good jobs- bad
Q113: Refer to Table 13- 1.The marginal revenue
Q118: Refer to Figure 13- 5.The panel that
Q165: Refer to Table 34-1.What is the net
Q166: Suppose there are only two countries in