The diagram below shows supply and demand curves for bicycles in the domestic Canadian market.Assume that all bicycles are identical. 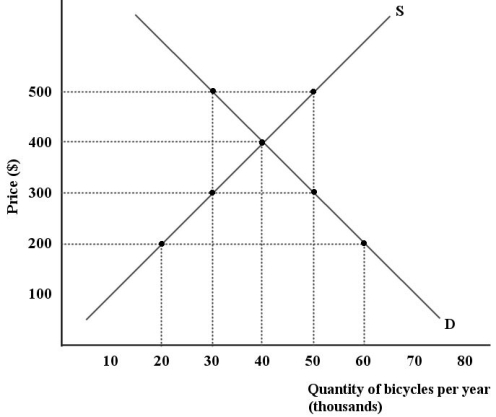 FIGURE 33-4
-Refer to Figure 33-4.Suppose the world price of bicycles is $200 and Canada has in place a 50% tariff on this good.The deadweight loss to the Canadian economy resulting from this tariff is ________ per year.
Definitions:
Travel
The movement of people between distant geographical locations, which can be done by foot, bicycle, automobile, train, boat, bus, airplane, or other means.
Sound Registering
The process of detecting and recognizing sound waves by auditory systems.
DbA
DbA refers to a unit of measurement for sound intensity, adjusted to the human ear's response to different frequencies, indicating the apparent loudness of sounds.
Mass Transit
Public transportation systems designed to move large numbers of people efficiently across cities and other populated areas.
Q21: The main difference between perfect competition and
Q33: Specialization of labour led to greater efficiency
Q35: There will be a favourable change in
Q37: Refer to Table 10- 2.The marginal cost
Q50: The total amount of unemployment in the
Q53: Refer to Figure 11- 3.Which of the
Q74: To reduce short-term market interest rates,the Bank
Q83: Canada is a net importer of durable
Q88: If a monopolist is practicing perfect price
Q171: Trade-remedy policies commonly used to achieve a