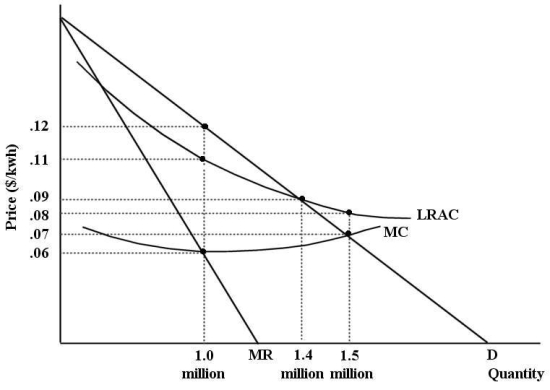
The diagram below shows cost and revenue curves for a natural monopoly producing electricity.Price is dollars per kilowatt hour and quantity is kilowatt hours per day.  FIGURE 12-7
-Refer to Figure 12-7.Suppose this firm is being regulated using a policy of marginal-cost pricing.The resulting price and output would be ________ per kwh and ________ kwh per day.
Definitions:
Complement
A good or service that is used together with another good or service, increasing demand for both.
Substitute
A good or service that can be used in place of another good or service, typically because it serves a similar function or satisfies the same needs.
Demand Equation
A mathematical representation of the demand curve, expressing the relationship between the quantity demanded and various factors that influence it, such as price.
Marginal Utility
The supplementary enjoyment or value someone gains from consuming one more unit of a certain good or service.
Q4: The excess-capacity theorem predicts that<br>A)when price-taking firms
Q10: Refer to Figure 17-5.Suppose the government requires
Q13: One reason that national defence is a
Q15: In which of the following situations would
Q43: Suppose a firm is using 100 units
Q58: Labour-market discrimination,which keeps one group of workers
Q70: Suppose ABC Corp.is a firm producing newsprint
Q76: In the long run,a profit-maximizing firm produces
Q77: Refer to Table 13-2.This firm begins to
Q132: If the demand curve faced by a