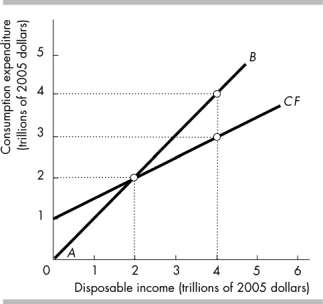
-In the above figure, the line AB is called
Definitions:
Total Utility
The total enjoyment gained from the use of a particular cumulative amount of a product or service.
Average Cost Curve
A graphical representation showing how the average cost of production changes as the quantity of output is increased.
Production Method
The process or technique used to create goods or services, which can include aspects of labor, machinery, technology, and inputs.
Marginal Cost Curve
The Marginal Cost Curve graphs the cost incurred by producing one more unit of a good, typically showing how this cost changes with increased production.
Q17: ʺAggregate planned expenditure is the sum of
Q172: Critics of the real business cycle theory
Q185: The _states that the main source of
Q208: The short-run Phillips curve shows the _relationship
Q216: The data below show data for
Q314: Using the data from the above table,
Q319: According to the real business cycle RBC)
Q325: Suppose that in a particular economy, the
Q358: If oil prices increase, then in the
Q365: The short-run aggregate supply curve_<br>A) illustrates the