The diagram below shows desired aggregate expenditure for a hypothetical economy. Assume the following features of this economy:
· marginal propensity to consume mpc) = 0.80
· net tax rate t) = 0.15
· no foreign trade
· fixed price level
· all expenditure and income figures are in billions of dollars.
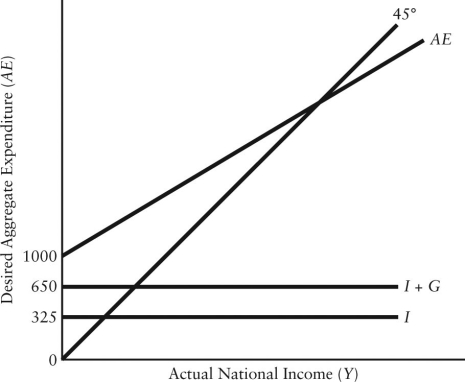 FIGURE 22-3
-Refer to Figure 22-3. Which of the following equations describes the aggregate expenditure function for this economy?
Definitions:
Coercive Power
A form of authority that relies on the threat of force or punishment to compel obedience.
Reward Power
is a form of influence where an individual has control over the distribution of rewards, motivating others to follow directions or achieve goals.
Referent Power
The influence one has over others because they respect, admire, or like the individual.
Organizational Learning
The process by which organizations acquire, improve, and manage knowledge to better adapt and succeed.
Q17: Governmentʹs transfer payments to individuals affect desired
Q25: Consider the simplest macro model with demand-determined
Q40: Consider two economies, A and B. Economy
Q48: The aggregate supply AS) curve is drawn
Q81: Refer to Table 24-1. In which economy
Q94: Refer to Table 21-5. At the equilibrium
Q97: Consider the simple multiplier when the price
Q98: Refer to Table 21-2. The marginal propensity
Q127: When compared to a simple macroeconomic model
Q133: Consider a consumption function of the following