The diagram below shows two budget deficit functions for a hypothetical economy.
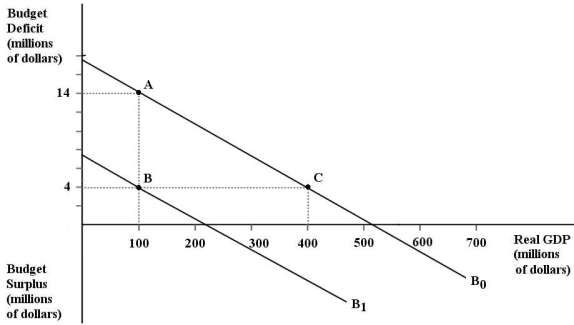 FIGURE 32- 2
-Refer to Figure 32- 2. Initially, suppose that real GDP is $100 million and the budget deficit is $14 million, as shown by point A. Which of the following events could result in a move from point A to point B?
Definitions:
Absolute Advantage
The ability of a country or entity to produce a good or service more efficiently than another country or entity.
Comparative Advantage
The ability of a country, individual, company, or region to produce a good or service at a lower opportunity cost than competitors.
Trade
The process of purchasing, selling, or trading goods and services among individuals, companies, or nations.
Equilibrium Price
The price at which the quantity of a good or service demanded equals the quantity supplied, resulting in market balance without excess supply or demand.
Q21: Quantity demanded is the<br>A)total amount of a
Q30: Which of the following will lead to
Q32: The term "demand for money" usually refers
Q50: Suppose economists were able to measure frictional
Q62: If Canadian demand for French wine increases,
Q65: Suppose the Bank of Canada lowers its
Q82: When the actual unemployment rate is equal
Q94: If the Bank of Canada wants to
Q112: Refer to Figure 34- 4. Assume there
Q129: Given the data in Table 1A.4.1, holding