In the below diagram assume that the aggregate demand curve shifts from AD1 in year 1 to AD2 in year 2, only to fall back to AD1 in year 3. 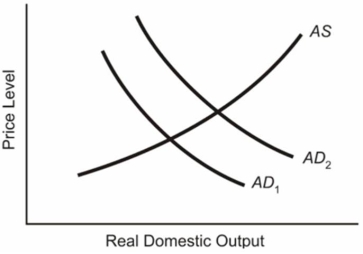 (a) Explain what will happen to the equilibrium price level and the equilibrium level of real GDP from year 1 to year 2.(b) Locate the new position in year 3 on the assumption that prices and wages are completely flexible downward.Label this position, Pb and GDPb for the price level and real GDP respectively.(c) Locate the new position in year 3 on the assumption that prices and wages are completely inflexible downward.Label this position, Pc and GDPc for the price level and real GDP respectively.
Definitions:
Net Cash Flow
The difference between a company's cash inflows and outflows within a defined period.
Operating Activities
Part of cash flow that represents the revenues and expenses directly related to the core business operations.
Financial Statements
A set of formal records that outline the financial activities and position of a business, individual, or other entity, typically comprising the balance sheet, income statement, and cash flow statement.
Statement Of Cash Flows
A financial report that shows how changes in balance sheet accounts and income affect cash and cash equivalents, breaking the analysis down to operating, investing, and financing activities.
Q4: What is the difference in the explanation
Q9: Suppose the First National Bank has the
Q10: In this list, identify those investments which
Q12: What is the effect on the multiplier
Q16: Which of the following is a positive
Q25: What are the two instruments the Bank
Q33: Supply in a market is represented by
Q33: Explain the effect of a cut in
Q34: Can a large public debt cause a
Q58: How do income changes affect the position