Essay
Explain how the below graph illustrates the built-in stability of the tax structure. 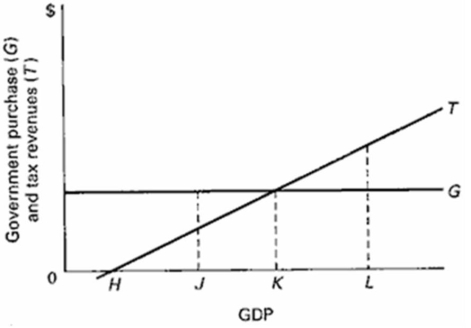
Definitions:
Related Questions
Q5: Suppose that a decrease in the price
Q9: Suppose that we are in a condition
Q14: How does the use of money differ
Q24: How much faster will a nation's Real
Q28: Explain what is meant by a built-in
Q30: How can the government finance its expenditures?
Q35: Describe and explain what is meant by
Q46: The following are simplified balance sheets for
Q70: In 2016, high-income countries had 16 percent
Q98: <img src="https://d2lvgg3v3hfg70.cloudfront.net/TB6686/.jpg" alt=" Refer to the