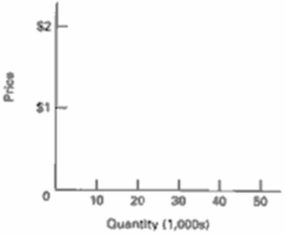
Using the schedules given, plot the demand curve and the supply curve on the below graph.Label the axes and indicate for each axis the units being used to measure price and quantity.Then answer the questions. 
 (a) Give the equilibrium price and quantity for oats.(b) Indicate the equilibrium price and quantity on the graph by drawing lines from the intersection of the supply and demand curves to the price and quantity axes.(c) If the Federal government decided to support the price of oats at $1.40 per ton, tell whether there would be a surplus or shortage and how much it would be.(d) Demonstrate your answer to part (c) on your graph being sure to label the quantity you designated as the shortage or surplus.
Definitions:
Implementation Stage
The phase in a project or plan where strategies and designs are put into operation or executed.
Salesforce Motivation
Strategies and techniques employed to inspire and energize a sales team to achieve or exceed their sales targets.
Salesforce Training
The process of providing education and skill development to a company's sales team to improve their selling techniques and effectiveness.
Account Management Policies
Guidelines and practices for handling customer accounts, including communication, sales, service, and issue resolution.
Q5: What is the importance of competition in
Q5: The following is a list of figures
Q15: Define modern economic growth.When did it seem
Q22: Luigi is a sociology student who has
Q23: If prices are stuck, how can firms
Q30: What are inventories and what role do
Q32: Dependency theorists argue that low-income countries are
Q32: A production possibilities table for two products,
Q40: According to Robert K. Merton, what are
Q47: Identify two key tools of monetary policy.