Multiple Choice
The diagram below shows two production possibilities boundaries for Country X. 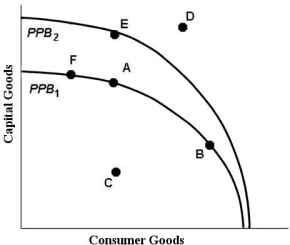 FIGURE 1- 3
-Refer to Figure 1- 3. If Country X, constrained by the production possibilities boundary PPB1, is currently producing at point A, it can produce more capital goods by moving to point
Definitions:
Related Questions
Q16: What is NOT a job of a
Q19: When we have a situation where we
Q32: Suppose that a single- price monopolist
Q35: Refer to Figure 12- 5. In the
Q48: In a marketing plan, tactical plans come
Q51: When calculating the acquisition cost for a
Q56: Refer to Figure 12- 6. Suppose this
Q76: In , we need to choose segments
Q76: If marketers want to be listened to
Q92: Refer to Figure 11- 4. What is