The following diagram shows three Lorenz curves for countries A, B, and C. The area between the Lorenz curve and the diagonal is 1,000 for Country A, 2,000 for Country B, and 2,500 for Country C. (The entire area under the diagonal is 5,000 because the area of the triangle is ½ × (base × height) = ½ × (100 × 100) = 5,000.)
(1) Calculate the Gini coefficient for each country.
(2) Based on the Gini coefficient, which country has the most equal distribution of income? Which country has the least? 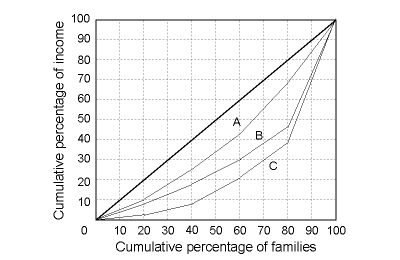
Definitions:
Selling and Administrative
Expenses associated with the general operations of a business, including costs related to sales, marketing, and the management of the company.
Variable Cost
Costs that vary directly with the level of production or sales volume, such as materials and labor.
Fixed Cost
A cost that does not change with an increase or decrease in the amount of goods or services produced or sold.
Q3: Consider the following information about production
Q6: If one were to observe the short-run
Q9: What are trade adjustment assistance programs? Describe
Q11: Why, in recent years, have many potential
Q12: What is the cost minimization condition?
Q15: How has increased international competition changed antitrust
Q28: What is meant by "the fallacy of
Q33: Why is allocation of market share such
Q38: In the following scenario, consider the early
Q84: Because of her job, Laura was exposed