The following scatterplot represents the results of a study undertaken by Chakrabarty et al. (2005) who were investigating glutamate levels in psychotropic drug-naive OCD patients and comparing them with psychiatrically normal controls. Based on this scatterplot the following ANCOVA of glutamate levels in CSF was done. Findings were reported as follows for CSF glutamate levels in OCD patients compared to controls: F(1,29) =11.153, p=0.002. What conclusion can be drawn about this result? 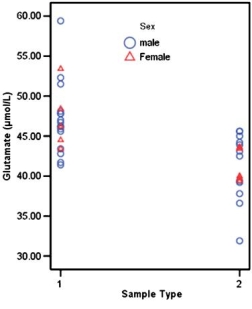 Scatterplot showing CSF glutamate levels in patients (1) and controls (2) . Source: http:/ / www.nature.com/ npp/ journal/ v30/ n9/ full/ 1300733a.html
ANCOVA of Glutamate Levels in CSF Diagnosis (OCD vs Controls) and gender were included as factors, while age, number of years of illness, total Y-BOCS scores, and CGI-S scores were included as covariates in the analysis.
Source: http:/ / www.nature.com/ npp/ journal/ v30/ n9/ full/ 1300733a.html
Definitions:
Q2: In what state was President Barack Obama
Q5: Bracing the hand holding the needle assembly
Q5: Which of the following is not recommended
Q9: Which of the following is not part
Q18: Correlational studies allow the researcher to<br>A) Test
Q21: In IBM SPSS,where in the menu can
Q21: The 99% confidence interval usually is:<br>A)Narrower than
Q23: Correct palpation of a vein includes all
Q23: A researcher was interested in predicting whether
Q31: A researcher wanted to know if people