Table 2-6
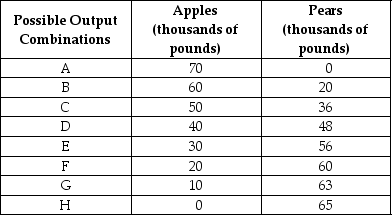
-Refer to Table 2-6. The Fruit Farm produces only apples and pears. The table above shows the maximum possible output combinations of the two fruits using all resources and currently available technology.
a. Graph the Fruit Farm's production possibilities frontier. Put apples on the horizontal axis and pears on the vertical axis. Be sure to identify the output combination points on your diagram.
b. Suppose the Fruit Farm is currently producing at point D. What is the opportunity cost of producing an additional 8,000 pounds of pears?
c. Suppose the Fruit Farm is currently producing at point D. What happens to the opportunity cost of producing more and more pears? Does it increase, decrease, or remain constant? Explain your answer.
d. Suppose the Fruit Farm is currently producing at point G. What happens to the opportunity cost of producing more and more apples? Does it increase, decrease, or remain constant? Explain your answer.
e. Suppose the Fruit Farm is plagued by the apple maggot infestation which destroys apple trees but not pear trees. Show in a graph what happens to its PPF.
Definitions:
Washing Machines
Appliances designed for cleaning laundry by combining water, detergent, and mechanical action.
Party In Breach
The individual or entity that fails to fulfill their contractual obligations, thus violating the agreement.
Sales Contract
An agreement between a buyer and seller outlining the terms and conditions of the sale of goods or services.
Risk Of Loss
The possibility that an asset or investment's value will decrease or will be irretrievably damaged or lost.
Q35: Which of the following is not an
Q136: DeShawn's Detailing is a service that details
Q174: Refer to Table 2-6. The Fruit Farm
Q182: A decrease in the demand for eggs
Q214: In economics, the term "equity" means<br>A) everyone
Q252: Ranchers can raise either cattle or sheep
Q329: Refer to Figure 3-6. The figure above
Q378: Without an increase in the supply of
Q389: Suppose that McDonald's successfully implements self-serve kiosks
Q470: Refer to Figure 3-8. The graph in