Multiple Choice
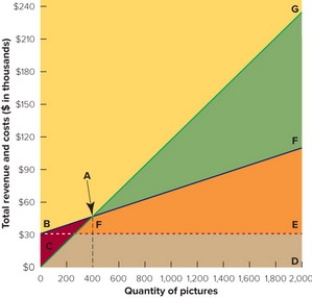 Figure 13-7B
-In the break-even chart in Figure 13-7 above, the triangular area GAF represents the firm's
Definitions:
Related Questions
Q49: Companies are reluctant to lower their selling
Q99: Which of these best illustrates a shift
Q122: Which of the following would be an
Q128: Step 1 of the price-setting process identifies
Q147: The newer a product and the earlier
Q185: Predatory pricing is<br>A) most effective in the
Q185: When a product reaches the decline stage
Q186: The new sharing economy consists of all
Q275: When Wendy's wants to increase the value
Q284: For which of these products is its