Table 7.1
Factors foe Calculating Thee- Segma L.tmits for the -chart and -chart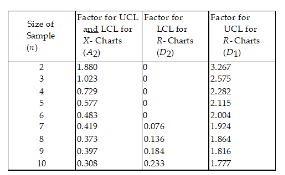
-Historically, the average diameter of the holes drilled has been 0.25 cm and the average range has been 0.1 cm. Determine the central line and upper and lower control limits for an and an R- chart, assuming samples of size 8 will be taken. Use Table 7.1. For the R- chart, what is the value of the UCLR ?
Definitions:
Game Sales
The total revenue generated from the sale of video games within a specific timeframe.
Weighted Average Model
A mathematical method that calculates the mean of a set of numbers, where some numbers contribute more significantly to the final average due to their respective weights.
Exponential Smoothing Model
A time series forecasting method that applies weighting factors which decrease exponentially to past observations.
Simple Exponential Smoothing
A time series forecasting method for univariate data that uses a weighted average of past observations, with the weights declining exponentially as the observations get older.
Q2: Describe five types of waste that often
Q11: One way to achieve employee involvement is
Q12: Waiting line models are often used for
Q16: Quality engineering is an approach that involves
Q20: This is the most important thing an
Q42: Explain the distinction between effective capacity and
Q100: A JIT II system brings the supplier
Q109: Typically, the cost of capital is not
Q129: Which one of the following statements is
Q130: Using the information from Table 5.2, what