The graph below illustrates the average and marginal product of labour for Get Smart Enterprises.
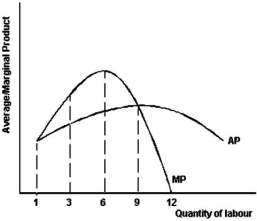
-Refer to the graph above to answer this question.How many units of labour does the firm need to employ to achieve an output that minimizes marginal cost?
Definitions:
Market Price
The present cost at which one can buy or sell an item or service in a competitive market environment.
Perfectly Elastic
A situation where the demand or supply responds infinitely to changes in price, resulting in a horizontal demand or supply curve.
Perfectly Inelastic
A market condition where the quantity demanded or supplied does not change in response to price changes; the demand or supply curve is perfectly vertical.
Relatively Elastic
Describes a situation where a small change in price leads to a significant change in quantity demanded or supplied.
Q5: Refer to the graph above to answer
Q14: Refer to the information above to answer
Q22: Why would firms want to operate at
Q27: A call bull spread strategy is appropriate
Q32: A university student uses a 'commodity futures'
Q42: Assume a three- month put option on
Q70: Portfolio insurance is a technique that:<br>A) programs
Q111: What is the term for the annual
Q117: Refer to the above graph to answer
Q118: All of the following, except one, are