Multiple Choice
Figure 10.10 depicts the cost and revenue curves for a monopolist.
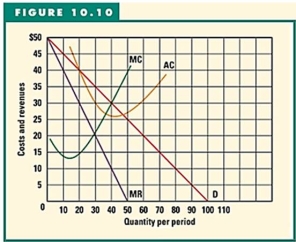
-Refer to Figure 10.10 to answer this question.What is the level of profits at the profit-maximizing output?
Definitions:
Related Questions
Q3: Suppose the marginal product of capital is
Q21: Refer to the above information to answer
Q38: Burial metamorphism involves processes of:<br>A) heat and
Q50: Stability of silicate minerals follows the inverse
Q55: Refer to the graph above to answer
Q82: Suppose that the current price of oil
Q87: Given the following production possibility curve.
Q95: Meridith had only $16 to spend this
Q103: Refer to the graph above. Area C
Q104: The home appliance, automotive, brewing and computer