You are given the following Dornbusch-Fischer-Samuelson (DFS) graph, where a1 = the Labor-time needed per unit of output in any given industry in the home country, a2 = the Labor-time needed per unit of output in any given industry in the foreign country, W1 = The wage rate in the home country, and W2 = the wage rate in the foreign country. The Exchange rate e is assumed = 1.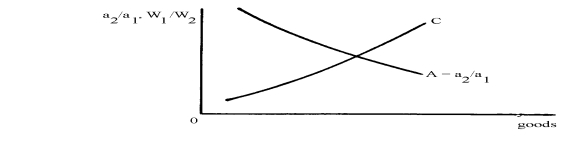
FIGURE 1
In this Dornbusch-Fischer-Samuelson graph, moving to the right along the A line indicates goods in which the __________ country has greater relative efficiency; further, The introduction of technical progress in the foreign country would, other things equal, be Reflected in __________ shift of the curve.
Definitions:
Net Capital Outflow
The net flow of funds invested abroad by a country, over a specific time period, typically calculated as the difference between domestic savings and investment.
GDP
Gross Domestic Product (GDP) is the total monetary value of all goods and services produced within a country's borders in a specific time period, serving as a broad indicator of economic health.
Consumption Expenditures
The total amount spent by consumers on goods and services.
Net Capital Outflow
The investment gap where residents of a country engage in foreign asset acquisition versus foreign entities buying up local assets.
Q1: Explain, using offer curves, how a tariff
Q1: Given the following diagram that shows the
Q5: Despite the general agreement among economists on
Q9: Mark is a carrier of PKU; Sandra
Q9: Before asking her students to read a
Q19: You are given the following Dornbusch-Fischer-Samuelson (DFS)
Q25: (Questions 17 and 18 pertain to material
Q28: While rating Lucy on her characteristics, Divya
Q29: In the following diagram,<br><img src="https://d2lvgg3v3hfg70.cloudfront.net/TB1413/.jpg" alt="In the
Q31: If technological change in an industry results,