Multiple Choice
Use the following to answer questions
This table and figure depict the average SAT scores for entering freshmen in the year 1995 at 36 North Carolina colleges.
Figure: Histogram of SAT 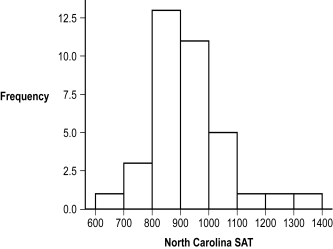
-(Figure: Histogram of SAT) Based on the frequency distribution, approximately how many participants scored 1000 or above?
Definitions:
Related Questions
Q4: The data used for a Spearman correlation
Q9: The nonparametric equivalent of the Pearson correlation
Q21: When working with two nominal variables, a
Q47: Assume a positive correlation is found between
Q51: The first step in creating a scatterplot
Q55: A z score of 0 is equivalent
Q90: The term _ is used for the
Q90: What is the correct formula for
Q110: The formula for calculating the raw
Q142: When one rejects the null hypothesis, it