Examlex

Solved

TABLE 13- 11
a Company That Has the Distribution Rights

question 193

Short Answer

TABLE 13- 11
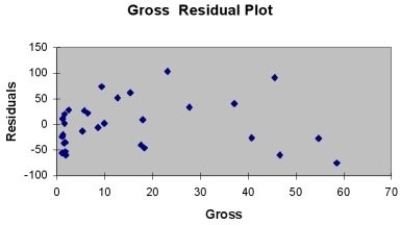
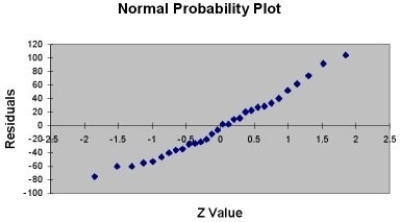
A company that has the distribution rights to home video sales of previously released movies would like to use the box office gross (in millions of dollars) to estimate the number of units (in thousands of units) that it can expect to sell. Following is the output from a simple linear regression along with the residual plot and normal probability plot obtained from a data set of 30 different movie titles:
 Regression Statistics  Multiple R 0.8531 R Square 0.7278 Adjusted R Square 0.7180 Standard Error 47.8668 Observations 30\begin{array}{lc}\hline \text { Regression Statistics } & \\\hline \text { Multiple R } & 0.8531 \\\text { R Square } & 0.7278 \\\text { Adjusted R Square } & 0.7180 \\\text { Standard Error } & 47.8668 \\\text { Observations } & 30\end{array}

ANOVA
 d f SS  MS Significance FRegression 1171499.78171499.7874.85052.1259E09Residual2864154.422291.23Total29235654.20\begin{array}{lrrrrr}\hline &\text { d f}& \text { SS } & \text { MS } & \text {F }& \text {Significance F} \\\hline \text {Regression }& 1 & 171499.78 & 171499.78 & 74.8505 & 2.1259E-09 \\\text {Residual} & 28 & 64154.42 & 2291.23 & & \\\text {Total} & 29 & 235654.20 & & & \\\hline\end{array}

Coefficients  Standard Error t Stat  p -value Lower 95% Upper 95%  Intercept 76.535111.83186.46865.24E0752.2987100.7716Gross4.33310.50088.65162.13E093.30725.3590\begin{array}{lrrrrrr}\hline & \text {Coefficients }& \text { Standard Error}& \text { t Stat }& \text { p -value }& \text {Lower 95\% }& \text {Upper 95\% }\\\hline \text { Intercept }& 76.5351 & 11.8318 & 6.4686 & 5.24 \mathrm{E}-07& 52.2987 & 100.7716 \\ \text {Gross} & 4.3331 & 0.5008 & 8.6516 & 2.13 \mathrm{E}-09 & 3.3072 & 5.3590 \\\hline\end{array}

 TABLE 13- 11 A company that has the distribution rights to home video sales of previously released movies would like to use the box office gross (in millions of dollars) to estimate the number of units (in thousands of units) that it can expect to sell. Following is the output from a simple linear regression along with the residual plot and normal probability plot obtained from a data set of 30 different movie titles:   \begin{array}{lc} \hline \text { Regression Statistics } & \\ \hline \text { Multiple R } & 0.8531 \\ \text { R Square } & 0.7278 \\ \text { Adjusted R Square } & 0.7180 \\ \text { Standard Error } & 47.8668 \\ \text { Observations } & 30 \end{array}   ANOVA  \begin{array}{lrrrrr} \hline &\text { d f}& \text { SS } & \text { MS } & \text {F }& \text {Significance F}  \\ \hline \text {Regression }& 1 & 171499.78 & 171499.78 & 74.8505 & 2.1259E-09 \\ \text {Residual} & 28 & 64154.42 & 2291.23 & & \\ \text {Total} & 29 & 235654.20 & & & \\ \hline\end{array}    \begin{array}{lrrrrrr} \hline &  \text {Coefficients }& \text { Standard Error}& \text { t  Stat }&  \text { p -value }&  \text {Lower 95\% }& \text {Upper 95\% }\\ \hline \text { Intercept }& 76.5351 & 11.8318 & 6.4686 & 5.24 \mathrm{E}-07& 52.2987 & 100.7716 \\  \text {Gross} & 4.3331 & 0.5008 & 8.6516 & 2.13 \mathrm{E}-09 & 3.3072 & 5.3590 \\ \hline \end{array}        -Referring to Table 13-11, what is the critical value for testing whether there is a linear relationship between box office gross and home video unit sales at a 5% level of significance?  TABLE 13- 11 A company that has the distribution rights to home video sales of previously released movies would like to use the box office gross (in millions of dollars) to estimate the number of units (in thousands of units) that it can expect to sell. Following is the output from a simple linear regression along with the residual plot and normal probability plot obtained from a data set of 30 different movie titles:   \begin{array}{lc} \hline \text { Regression Statistics } & \\ \hline \text { Multiple R } & 0.8531 \\ \text { R Square } & 0.7278 \\ \text { Adjusted R Square } & 0.7180 \\ \text { Standard Error } & 47.8668 \\ \text { Observations } & 30 \end{array}   ANOVA  \begin{array}{lrrrrr} \hline &\text { d f}& \text { SS } & \text { MS } & \text {F }& \text {Significance F}  \\ \hline \text {Regression }& 1 & 171499.78 & 171499.78 & 74.8505 & 2.1259E-09 \\ \text {Residual} & 28 & 64154.42 & 2291.23 & & \\ \text {Total} & 29 & 235654.20 & & & \\ \hline\end{array}    \begin{array}{lrrrrrr} \hline &  \text {Coefficients }& \text { Standard Error}& \text { t  Stat }&  \text { p -value }&  \text {Lower 95\% }& \text {Upper 95\% }\\ \hline \text { Intercept }& 76.5351 & 11.8318 & 6.4686 & 5.24 \mathrm{E}-07& 52.2987 & 100.7716 \\  \text {Gross} & 4.3331 & 0.5008 & 8.6516 & 2.13 \mathrm{E}-09 & 3.3072 & 5.3590 \\ \hline \end{array}        -Referring to Table 13-11, what is the critical value for testing whether there is a linear relationship between box office gross and home video unit sales at a 5% level of significance?
-Referring to Table 13-11, what is the critical value for testing whether there is a linear relationship between box office gross and home video unit sales at a 5% level of significance?


Definitions:

Dyadic Relationships

Two-person interactions or relationships, often analyzed in the context of leadership or management.

LMX

Leader-Member Exchange, a theory focusing on the two-way (dyadic) relationship between leaders and followers.

In-group Followers

Followers who are considered part of a leader's inner circle and typically enjoy closer relationships and more privileges than out-group members.

Leader-member Exchange Theory

A theory that emphasizes the quality of relationships between leaders and followers, proposing that better relationships lead to higher organizational outcomes.

Related Questions