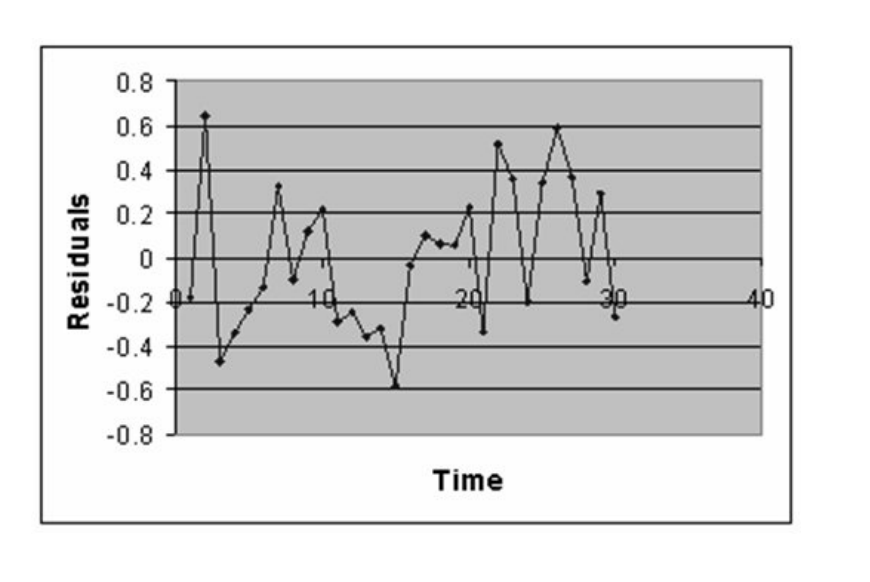
TABLE 13-12
The manager of the purchasing department of a large banking organization would like to develop a model to predict the amount of time (measured in hours) it takes to process invoices. Data are collected from a sample of 30 days, and the number of invoices processed and completion time in hours is recorded. Below is the regression output:
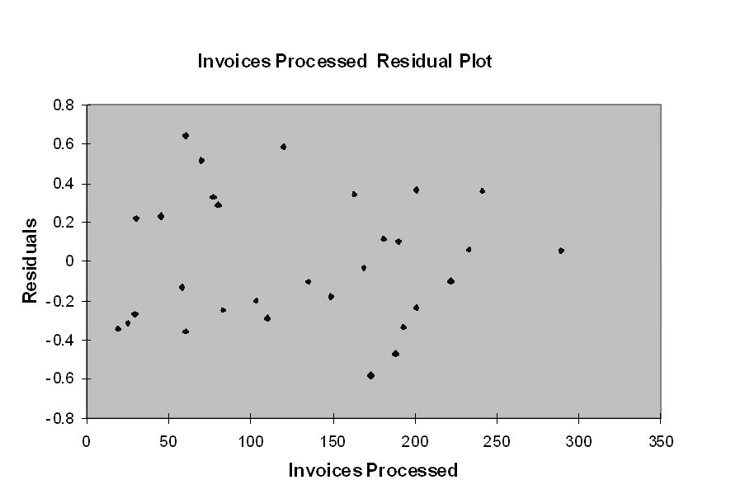
-Referring to Table 13-12, there is a 95% probability that the average amount of time needed to process one additional invoice is somewhere between 0.0109 and 0.0143 hours.
Definitions:
Standard Deviation
A statistic that denotes the dispersion or variability of a dataset relative to its mean, indicating how spread out the data points are.
Margin of Error
A statistic expressing the amount of random sampling error in a survey's results, indicating how much you can expect the survey results to reflect the views of the overall population.
Probability
The measure of the likelihood that a particular event will occur, expressed as a number between 0 and 1.
Standard Error
Indicates the standard deviation of the sampling distribution of a statistic, most commonly the mean.
Q28: Referring to Table 15-9, which of the
Q30: Referring to Table 10-14, what is the
Q38: Referring to Table 11-7, using an overall
Q66: Referring to Table 11-8, what are the
Q76: Referring to Table 14-4, suppose the builder
Q89: If the sample sizes in each group
Q108: Referring to Table 14-16, we can conclude
Q146: Referring to Table 13-4, the standard error
Q185: Referring to Table 12-6, the same decision
Q212: Referring to Table 14-17, what is the