TABLE 10-2
A researcher randomly sampled 30 graduates of an MBA program and recorded data concerning their starting salaries. Of primary interest to the researcher was the effect of gender on starting salaries. The result of the pooled-variance t test of the mean salaries of the females (Population 1) and males (Population 2) in the sample is given below.
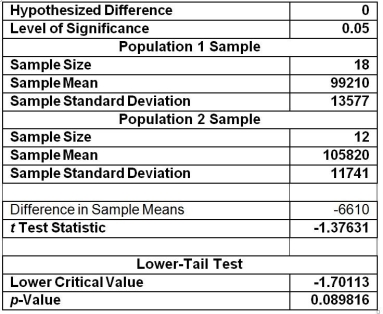
-Referring to Table 10-2, what is the 95% confidence interval estimate for the difference between two means?
Definitions:
Cause-and-Effect Diagram
A visual tool for identifying and organizing the potential causes of a problem in order to identify its root causes, also known as a fishbone or Ishikawa diagram.
Service Quality
The degree to which a service meets the customer's expectations, often evaluated based on factors like responsiveness, reliability, and professionalism.
Cause and Effect Diagram
Also known as a fishbone diagram, it is a tool used to systematically list and analyze the potential causes of a specific problem or effect.
Pareto Chart
A bar graph that represents the frequency or impact of problems or causes in a process, helping to identify the most significant factors.
Q2: To prove negligence a plaintiff must be
Q10: Referring to Table 10-11, construct a 90%
Q13: Referring to Table 12-10, the expected cell
Q43: Referring to Table 12-17, what is the
Q74: Referring to Table 12-9, there is sufficient
Q95: The chancellor of a major university was
Q121: Referring to Table 12-15, the rank given
Q122: A personal computer user survey was conducted.
Q134: The amount of calories contained in a
Q166: Referring to Table 10-12, construct a 99%