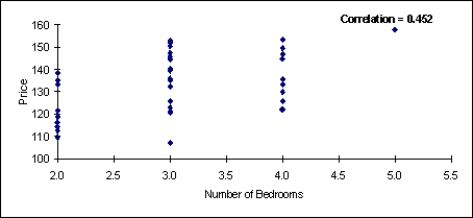
There are two scatterplots shown below. The first chart shows the relationship between the size of the home and the selling price. The second chart examines the relationship between the number of bedrooms in the home and its selling price. Which of these two variables (the size of the home or the number of bedrooms) seems to have the stronger relationship with the home's selling price? Justify your answer. 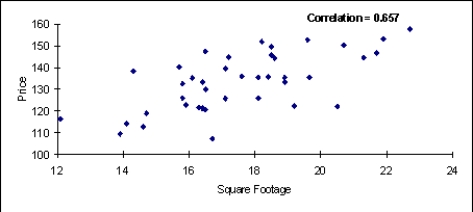
Definitions:
Modify The Report's Design
The process of changing the layout, structure, or visual appearance of a report in software applications to meet specific requirements or improve readability.
Preview
A feature that allows users to view a document, image, or webpage before it is finalized or printed, ensuring that it meets the desired appearance and accuracy.
The process of producing physical copies of documents, images, or data from a computer or other digital device onto paper or other printable materials.
Continue
In computing, it often means to proceed with the next set of instructions or to keep an operation going.
Q2: An oil delivery truck contains five compartments,
Q14: What is the distribution of X and
Q25: The financial CEO is given a group
Q26: The binomial distribution is a discrete distribution
Q38: What course of action is optimal for
Q39: It is common in computer simulations to
Q48: Suppose that Coke<sup>®</sup> and Pepsi<sup>®</sup> are in
Q58: Construct a decision tree to identify the
Q73: The average score for a class of
Q90: Which statement is true of proportional sample