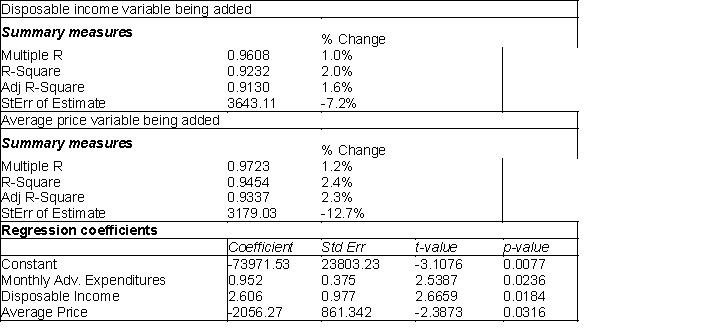
The owner of a pizza restaurant chain would like to predict the sales of her recent specialty, a Mediterranean flatbread pizza. She has gathered data on monthly sales of the Mediterranean flatbread pizza at her restaurants. She has also gathered information related to the average price of flatbread pizzas, the monthly advertising expenditures, and the disposable income per household in the areas surrounding the restaurants. Below you will find output from the stepwise regression analysis. The p-value method was used with a cutoff of 0.05. 
-(A) Summarize the findings of the stepwise regression method using this cutoff value.
(B) When the cutoff value was increased to 0.10, the output below was the result. The table at top left represents the change when the disposable income variable is added to the model and the table at top right represents the average price variable being added. The regression model with both added variables is shown in the bottom table. Summarize the results for this model.  (C) Which model would you recommend using? Why?
Definitions:
Bonds
Fixed-income instruments that represent a loan made by an investor to a borrower, typically corporate or governmental, which pay periodic interest payments and repay the principal at maturity.
Financial Assets
Assets that derive value from a contractual claim, such as stocks, bonds, bank deposits, and other securities.
Total Assets
The sum of all resources owned by an individual, corporation, or country, including both current and noncurrent assets.
U.S. Households
Refers to living arrangements or economic units in the United States consisting of one or more people who occupy a housing unit.
Q13: Simulate the price of the stock in
Q13: Multiple regression represents an improvement over simple
Q30: When practicing the presentation, use appropriate language,
Q40: What are the characteristics of the direct
Q47: Discuss the organization and content of a
Q54: In multiple regressions, if the F-ratio is
Q55: The adjusted R<sup>2</sup> is adjusted for the
Q73: In a simple linear regression problem, if
Q77: The flaw of averages is the reason
Q110: Laila, an Egyptian broker, is currently trying