Exhibit 16-1
In a regression analysis involving 25 observations, the following estimated regression equation was developed. 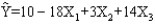 Also, the following standard errors and the sum of squares were obtained.
Sb1 = 3
Sb2 = 6
Sb3 = 7
SST = 4,800
SSE = 1,296
-Refer to Exhibit 16-1. If you want to determine whether or not the coefficients of the independent variables are significant, the critical value of t statistic at = 0.05 is
Definitions:
Resource Pricing
The determination of the price of resources or inputs used in production, based on factors like scarcity, demand, and cost of extraction.
Occupations
Various forms of employment or professions where individuals earn a living by performing specific tasks or services.
Fastest Growing
Referring to entities, such as industries or economies, that experience the most rapid expansion in terms of revenue, size, or influence within a specific period.
Elasticity
An indicator of the degree to which the demand or supply of a product fluctuates following a variation in its price.
Q3: The following are the results from
Q4: Sampling errors can<br>A)be avoided by increasing the
Q12: The upper and lower control limits of
Q24: Refer to Exhibit 14-1. The coefficient of
Q28: Suppose we are interested in investing in
Q37: Refer to Exhibit 14-7. The least squares
Q42: A regression model relating a dependent
Q50: The variable of interest in an ANOVA
Q100: At <span class="ql-formula" data-value="\alpha"><span class="katex"><span
Q111: An ANOVA procedure is used for data