Exhibit 16-4
In a laboratory experiment, data were gathered on the life span (Y in months) of 33 rats, units of daily protein intake (X1) , and whether or not agent X2 (a proposed life extending agent) was added to the rats diet (X2 = 0 if agent X2 was not added, and X2 = 1 if agent was added.) From the results of the experiment, the following regression model was developed. 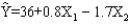 Also provided are SSR = 60 and SST = 180.
-Refer to Exhibit 16-4. The life expectancy of a rat that was not given any protein and that did not take agent X2 is
Definitions:
Strategy Maps
A visual representation that outlines the key objectives and their relationships within an organization's strategy, aiding in communication, planning, and execution.
Cause-and-effect Relationships
Connections between actions or events such that one or more are the result of the other or others.
Non-financial Performance
A measure of a company's effectiveness and efficiency in areas not directly related to financial metrics, such as customer satisfaction and employee engagement.
Operational Level
Pertains to the day-to-day activities and decisions within an organization that contribute to its overall performance.
Q18: A multiple regression model has the form
Q33: Refer to Exhibit 21-4. The expected value
Q35: Refer to Exhibit 19-4. The null hypothesis
Q60: A decision criterion which weights the payoff
Q83: Below you are given a partial
Q83: Refer to Exhibit 15-7. The test statistic
Q84: Refer to Exhibit 15-5. The t value
Q87: In order to compare the life
Q87: Refer to Exhibit 15-3. The conclusion is
Q89: An insurance company has gathered the