Multiple Choice
A time series plot of a period of time (in years) versus revenue (in millions of dollars) is shown below. Which of the following data patterns best describes the scenario shown? 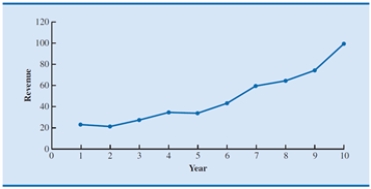
Definitions:
Formal Statement
A structured, written document that presents financial or other significant data in a systematic format.
Related Questions
Q9: _ merges maps and statistics to present
Q9: A feasible solution is _ if there
Q10: Excel's _ tool allows the user to
Q17: The impurity of a group of observations
Q21: The charts that are helpful in making
Q22: The t value for a 99% confidence
Q26: In preparing categorical variables for analysis, it
Q27: A description of the range and relative
Q40: In a fixed-cost problem, choosing excessively large
Q42: Fitting a model too closely to sample