The following figure shows a graph that compares the present values of two ordinary annuities of $800 quarterly as functions of the number of quarters. One annuity is at an annual rate of 6% compounded quarterly, and the other is at 9% compounded quarterly. What present value is required to purchase an annuity of $800 a quarter for 25 years with an interest rate of 9% compounded quarterly? Check your answer against the graph. Round your answer to the nearest cent. 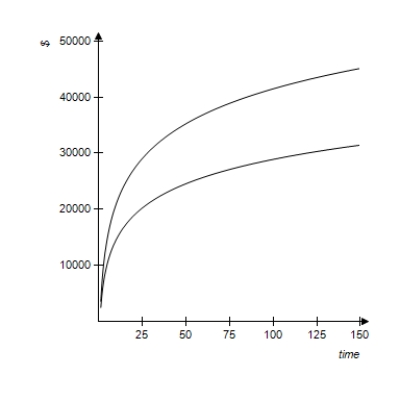
Definitions:
Q3: The Fish Commission states that the lengths
Q15: Suppose a primitive economy consists of two
Q18: Total personal income in the United States
Q62: A house is rented for $3,900 per
Q85: A political candidate wishes to use a
Q95: A survey questioned 1000 people regarding raising
Q139: A graph of <img src="https://d2lvgg3v3hfg70.cloudfront.net/TB1243/.jpg" alt="A graph
Q158: A system of linear equations and a
Q169: Find the steady-state vector associated with the
Q189: Use properties of limits and algebraic methods