Use the following information to answer the following questions.
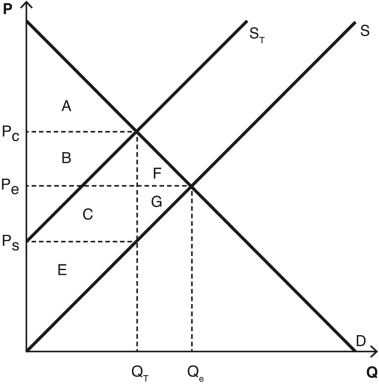
The following graph depicts a market where a tax has been imposed.Pe was the equilibrium price before the tax was imposed,and Qe was the equilibrium quantity.After the tax,PC is the price that consumers pay,and PS is the price that producers receive.QT units are sold after the tax is imposed.NOTE: The areas B and C are rectangles that are divided by the supply curve ST.Include both sections of those rectangles when choosing your answers.

-Which areas represent the amount of consumer surplus lost due to the tax?
Definitions:
Q19: The difference between nominal gross domestic product
Q21: Some states and localities have laws that
Q51: A real-life, long-run example of a binding
Q70: The phase of the business cycle where
Q93: To determine a value for gross domestic
Q95: What is Monica's opportunity cost of baking
Q102: The short-run fluctuations in economic activity that
Q117: To determine which of two producers has
Q149: Answer the following questions about a market
Q156: Is there an opportunity cost to increased