Multiple Choice
The following graph shows the demand for and the supply of a good in a country.If the world price of the good is $2.00 per unit and an import quota of 50 units per month is imposed,the welfare loss resulting from higher domestic production costs is represented by the area _____.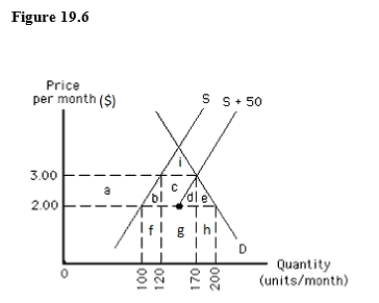
Definitions:
Related Questions
Q26: The immediate effects of a discretionary increase
Q48: Usually,a commercial bank's depositors and its owners
Q49: Which of the following identities describe the
Q58: Suppose an individual can earn 3 percent
Q64: If autumn 2013 sales were $20 500
Q72: If the U.S.dollar appreciates in the foreign
Q92: More than half the labor force in
Q95: Debit cards are safer than credit cards
Q95: Which of the following methods may be
Q149: M2 is the narrow measure of the