Multiple Choice
Figure 8-11 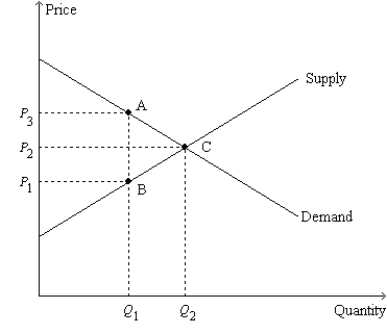
-Refer to Figure 8-11.The price labeled as P3 on the vertical axis represents the price
Definitions:
Related Questions
Q98: What do economists call the highest amount
Q100: Producer surplus is the<br>A) area under the
Q151: Assume,for Singapore,that the domestic price of soybeans
Q176: When a nation first begins to trade
Q185: Because taxes distort incentives,they cause markets to
Q191: Refer to Figure 8-1.Suppose the government imposes
Q247: Suppose that instead of a supply-demand diagram,you
Q303: Refer to Figure 9-1.From the figure it
Q362: Refer to Figure 9-9.Consumer surplus in this
Q449: In a recent research paper published by