Figure 8-19. The figure represents the relationship between the size of a tax and the tax revenue raised by that tax.
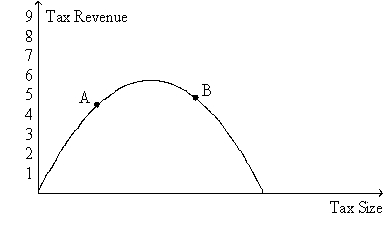
-Refer to Figure 8-19.If the economy is at point A on the curve,then a decrease in the tax rate will
Definitions:
AICPA
Stands for American Institute of Certified Public Accountants, a professional organization for Certified Public Accountants (CPAs) in the United States.
SEC
The U.S. Securities and Exchange Commission, the federal agency responsible for enforcing federal securities laws and regulating the securities industry.
FASB
stands for the Financial Accounting Standards Board, which is responsible for establishing accounting and financial reporting standards in the United States.
Total Liabilities
The combined debts and obligations that a company owes to outside parties at any given time.
Q8: Refer to Figure 8-6.When the government imposes
Q14: The marginal tax rate on labor income
Q68: Refer to Figure 7-6.If the government imposed
Q121: Which of the following is not an
Q130: Denmark is an importer of computer chips
Q156: Externalities are<br>A) side effects passed on to
Q161: Suppose that a university charges students a
Q295: Refer to Figure 9-1.From the figure it
Q295: Refer to Figure 8-10.Suppose the government imposes
Q343: A deadweight loss is a consequence of