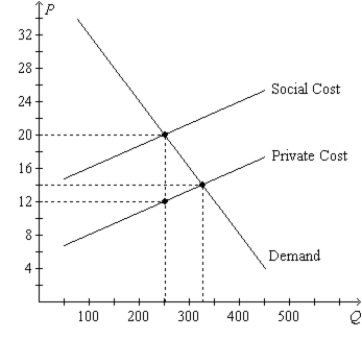
Figure 10-13. On the graph, Q represents the quantity of plastics and P represents the price of plastics. 
-Refer to Figure 10-13. If the government imposed a corrective tax that successfully moved the market from the market equilibrium to the social optimum, then tax revenue for the government would amount to
Definitions:
Q106: Corrective taxes differ from most taxes in
Q140: The Tragedy of the Commons can be
Q223: Refer to Figure 9-10.With trade,the equilibrium price
Q231: Refer to Figure 9-4.With no trade allowed,what
Q253: Refer to Figure 10-13.If the government imposed
Q315: An example of a private solution to
Q345: Which of the following statements is not
Q356: When a country that exported a particular
Q402: The Coase theorem suggests that private solutions
Q420: The small-economy assumption is necessary to analyze