Multiple Choice
The scatter chart below displays the residuals verses the dependent variable, x. Which of the following conclusions can be drawn based upon this scatter chart? 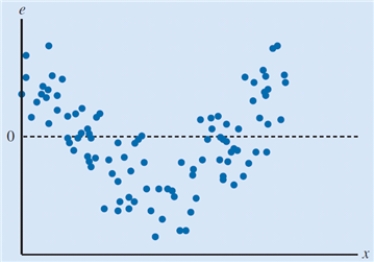
Definitions:
Related Questions
Q4: Observation refers to the<br>A)estimated continuous outcome variable.<br>B)set
Q21: Clever Sporting Equipment, Inc. makes two types
Q25: The correlation coefficient will always take values<br>A)greater
Q25: In the Bass forecasting model, the _
Q42: A feasible solution is _ if there
Q44: The modeling process begins with the framing
Q47: _ is a measure of calculating dissimilarity
Q49: The value of the _ is used
Q51: A measure of the outcome of a
Q62: In a linear regression model, the variable