Multiple Choice
The diagram below shows demand and cost curves for a monopolistically competitive firm. 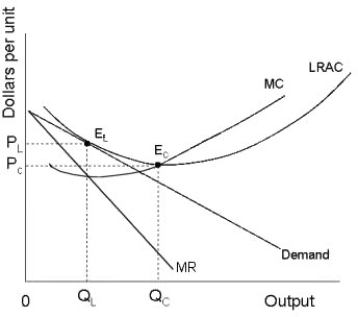 FIGURE 11- 3
-Refer to Figure 11- 3. Which of the following is a demonstration of the excess- capacity theorem?
Definitions:
Related Questions
Q10: Nancy's income has just risen from $950
Q17: If two goods, X and Y, have
Q36: Suppose national income is rising steadily at
Q58: Suppose a theory predicts that lowering tuition
Q58: If inventory is sold with terms of
Q61: If tastes change so that a particular
Q86: If average net fixed assets decrease, then
Q90: "Demand" in a particular market refers to<br>A)
Q120: On December 1, 2010, a company accepted
Q125: Plasma Inc., has net credit sales of