Multiple Choice
The diagram below shows two production possibilities boundaries for Country X. 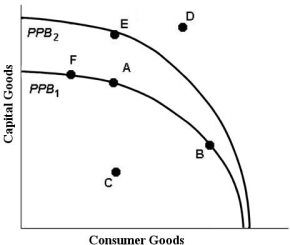 FIGURE 1- 3
-Refer to Figure 1- 3. Growth in the country's productive capacity is illustrated by
Definitions:
Related Questions
Q6: An understatement of the ending inventory balance
Q12: Refer to Figure 11-4. Given the information
Q16: Refer to Figure 10-5. Assume this pharmaceutical
Q16: Consider the following two statements. (1) An
Q32: What is the depreciation expense for 2011?<br>A)
Q37: Allocative efficiency is a property of the
Q45: Adventure Company uses the aging of accounts
Q49: Refer to Figure 12-6. Suppose this firm
Q104: What is the amount of the discount
Q131: The book value of a depreciable asset