SCENARIO 18-8
The superintendent of a school district wanted to predict the percentage of students passing a sixth- grade proficiency test.She obtained the data on percentage of students passing the proficiency test (% Passing),daily mean of the percentage of students attending class (% Attendance),mean teacher salary in dollars (Salaries),and instructional spending per pupil in dollars (Spending)of 47 schools in the state.
Following is the multiple regression output with Y = % Passing as the dependent variable, X1 =% Attendance, X 2 = Salaries and X3 = Spending: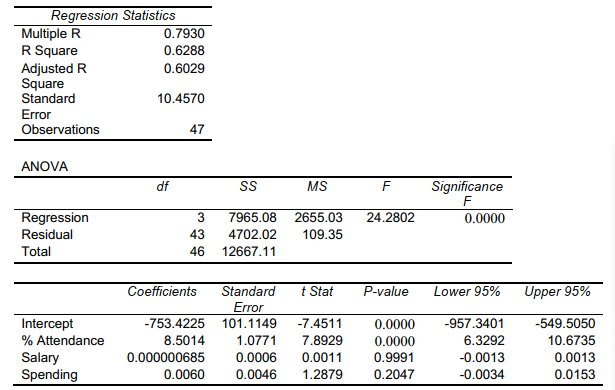
-Referring to Scenario 18-8,the null hypothesis H0 : 1 = 2 = 3 = 0 implies that percentage of students passing the proficiency test is not related to any of the explanatory variables.
Definitions:
Joint Probability Distribution
A mathematical description of the likelihood of two events occurring together and at the same point in time.
Car Salespeople
Individuals specialized in selling automobiles, often working at car dealerships.
Joint Probability Distribution
The probability distribution of two or more random variables happening simultaneously and their possible combinations.
Probability Distribution
This is a mathematic function that calculates how likely different outcomes are to occur in an experiment.
Q1: A physician and president of a Tampa
Q18: Referring to Scenario 16-13,if a five-month moving
Q19: The minimum expected opportunity loss is also
Q64: Referring to Scenario 15-6,what is the value
Q79: Referring to Scenario 19-8,construct an R chart
Q124: Referring to Scenario 16-12,in testing the significance
Q156: The control limits are based on the
Q158: Poke-Yoke devices establish ways to clean and
Q233: Referring to Scenario 18-10 Model 1,estimate the
Q236: Referring to Scenario 18-9,the 0 to 60