The figure given below shows the production possibility curves for Canada (AB) and the Rest of the World (CD) . The opportunity cost of producing one liter of maple syrup in Canada and in the Rest of the World are _____ bushels and _____ bushels of corn respectively. 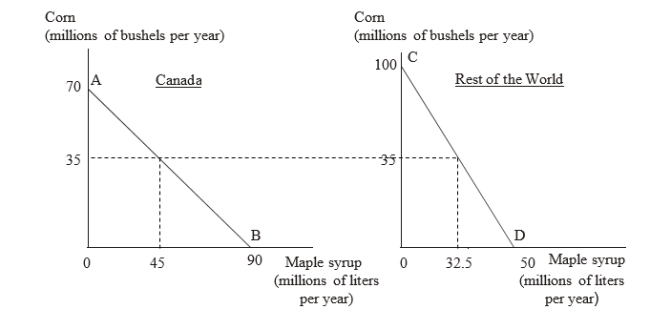
Definitions:
Price Remains The Same
A condition where the cost of a good or service does not change over a period of time.
Substitution Bias
Substitution bias occurs in inflation measurement and refers to the tendency of consumers to change their purchasing habits away from goods that have increased in price to cheaper alternatives, which is not always fully captured by price indexes.
CPI
The Consumer Price Index, which measures the average change over time in the prices paid by urban consumers for a market basket of consumer goods and services.
Consumer Substitution
The tendency of consumers to switch from one good to another in response to changes in relative prices, keeping their level of satisfaction or utility constant.
Q6: If country A is relatively abundant in
Q10: Explain how a mutually beneficial trade is
Q32: Calculate the effective rate of protection for
Q38: The table given below shows the
Q42: Suppose the domestic supply (Q<sup>S</sup>) and
Q45: The table given below shows the
Q46: In Heckscher-Ohlin theory, differences in _ across
Q50: In the United States, the tests used
Q54: Prepaid insurance should be included in the
Q82: Expected future operating losses can generally be