One of the problems when estimating the size of animal populations from aerial surveys is that animals may bunch together, making it difficult to distinguish and count them accurately. For example, a horse standing alone is easy to spot; if seven horses huddled close together some may be missed, resulting in an undercount. The relative frequency of undercounts is typically reported as a percent. For example, if there are 10 horses in a group, a person in the plane may typically count fewer than 10 horses 20% of the time. In a recent study, the percent of sightings that resulted in an undercount was related to the size of the "group" of horses and donkeys; the following data were gathered: 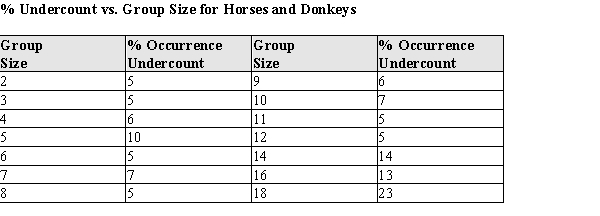 After fitting a straight line model,
  , significant curvature was detected in the residual plot, and two nonlinear models were chosen for further analysis, the exponential and the power models. The computer output for these models is given below, and the residual plots follow.
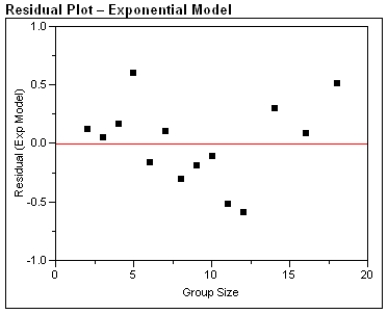
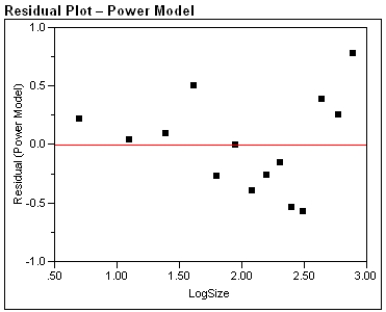
 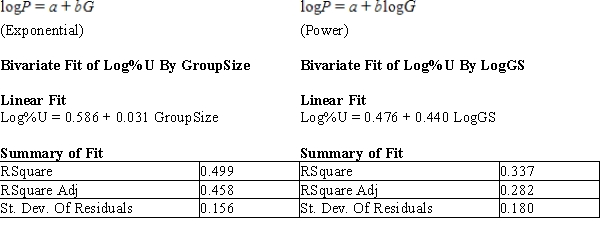 Residual Plots

a) For the exponential model, calculate the predicted log (%undercount) for a group size = 10.
b) Use your calculations from part (a) to predict the %undercount for a group size = 10.
c) Generally speaking, which of the two models, power or exponential, is better at predicting the log (Percent Undercount)? Provide statistical justification for your choice.
Definitions:
Depreciation
The systematic reduction of the recorded cost of a fixed asset over its useful life to reflect wear and tear or obsolescence.
Operating Cash Flow
The cash generated from normal operating activities of a business, reflecting its ability to generate sufficient cash to maintain operations.
Net Income
A company's overall income following the deduction of all expenditures and tax obligations from its total earnings.
Opportunity Costs
The loss of potential gain from other alternatives when one particular option is chosen over them.
Q2: One of the problems when estimating the
Q4: The level of significance of a test
Q9: Property blocks of code, that are used
Q16: All other things being equal, choosing a
Q17: When performing tests of hypotheses, there are
Q17: The model W = a + bL
Q38: Control objects and code objects share many
Q40: The P-value associated with the calculated F
Q56: If one For...Next loop begins inside another
Q75: Like other variables, array variables can be