Examlex

Solved

SCENARIO 12-11
a Computer Software Developer Would Like to Use

question 132

True/False

SCENARIO 12-11
A computer software developer would like to use the number of downloads (in thousands) for the trial version of his new shareware to predict the amount of revenue (in thousands of dollars) he can make on the full version of the new shareware.Following is the output from a simple linear regression
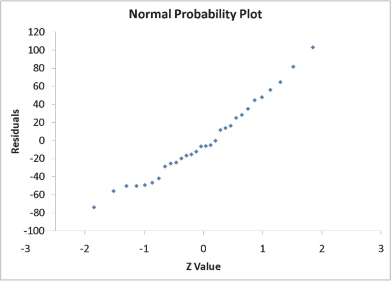
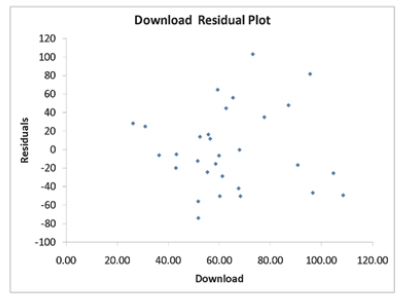
along with the residual plot and normal probability plot obtained from a data set of 30 different sharewares that he has developed:
 SCENARIO 12-11 A computer software developer would like to use the number of downloads (in thousands) for the trial version of his new shareware to predict the amount of revenue (in thousands of dollars) he can make on the full version of the new shareware.Following is the output from a simple linear regression along with the residual plot and normal probability plot obtained from a data set of 30 different sharewares that he has developed:     \begin{array}{lr} {\text { Regression Statistics }} \\ \hline \text { Multiple R } & 0.8691 \\ \hline \text { R Square } & 0.7554 \\ \hline \text { Adjusted R Square } & 0.7467 \\ \hline \text { Standard Error } & 44.4765 \\ \hline \text { Observations } & 30.0000 \\ \hline \end{array}    \text { ANOVA }    \begin{array}{|l|r|r|r|r|r|} \hline &\text { df } & \text { SS } & \text { MS } & F & \text { Significance } F \\  \hline \text { Regression } & 1 & 171062.9193 & 171062.9193 & 86.4759 & 0.0000 \\ \hline \text { Residual } & 28 & 55388.4309 & 1978.1582 & & \\ \hline \text { Total } & 29 & 226451.3503 & & \\ \hline \end{array}          Simple Linear Regression 12-41   -Referring to Scenario 12-11, the null hypothesis for testing whether there is a linear relationship between revenue and the number of downloads is  There is no linear relationship between revenue and the number of downloads .  Regression Statistics  Multiple R 0.8691 R Square 0.7554 Adjusted R Square 0.7467 Standard Error 44.4765 Observations 30.0000\begin{array}{lr}{\text { Regression Statistics }} \\\hline \text { Multiple R } & 0.8691 \\\hline \text { R Square } & 0.7554 \\\hline \text { Adjusted R Square } & 0.7467 \\\hline \text { Standard Error } & 44.4765 \\\hline \text { Observations } & 30.0000 \\\hline\end{array}

 ANOVA \text { ANOVA }
 df  SS  MS F Significance F Regression 1171062.9193171062.919386.47590.0000 Residual 2855388.43091978.1582 Total 29226451.3503\begin{array}{|l|r|r|r|r|r|}\hline &\text { df } & \text { SS } & \text { MS } & F & \text { Significance } F \\ \hline \text { Regression } & 1 & 171062.9193 & 171062.9193 & 86.4759 & 0.0000 \\\hline \text { Residual } & 28 & 55388.4309 & 1978.1582 & & \\\hline \text { Total } & 29 & 226451.3503 & & \\\hline\end{array}


 SCENARIO 12-11 A computer software developer would like to use the number of downloads (in thousands) for the trial version of his new shareware to predict the amount of revenue (in thousands of dollars) he can make on the full version of the new shareware.Following is the output from a simple linear regression along with the residual plot and normal probability plot obtained from a data set of 30 different sharewares that he has developed:     \begin{array}{lr} {\text { Regression Statistics }} \\ \hline \text { Multiple R } & 0.8691 \\ \hline \text { R Square } & 0.7554 \\ \hline \text { Adjusted R Square } & 0.7467 \\ \hline \text { Standard Error } & 44.4765 \\ \hline \text { Observations } & 30.0000 \\ \hline \end{array}    \text { ANOVA }    \begin{array}{|l|r|r|r|r|r|} \hline &\text { df } & \text { SS } & \text { MS } & F & \text { Significance } F \\  \hline \text { Regression } & 1 & 171062.9193 & 171062.9193 & 86.4759 & 0.0000 \\ \hline \text { Residual } & 28 & 55388.4309 & 1978.1582 & & \\ \hline \text { Total } & 29 & 226451.3503 & & \\ \hline \end{array}          Simple Linear Regression 12-41   -Referring to Scenario 12-11, the null hypothesis for testing whether there is a linear relationship between revenue and the number of downloads is  There is no linear relationship between revenue and the number of downloads .

 SCENARIO 12-11 A computer software developer would like to use the number of downloads (in thousands) for the trial version of his new shareware to predict the amount of revenue (in thousands of dollars) he can make on the full version of the new shareware.Following is the output from a simple linear regression along with the residual plot and normal probability plot obtained from a data set of 30 different sharewares that he has developed:     \begin{array}{lr} {\text { Regression Statistics }} \\ \hline \text { Multiple R } & 0.8691 \\ \hline \text { R Square } & 0.7554 \\ \hline \text { Adjusted R Square } & 0.7467 \\ \hline \text { Standard Error } & 44.4765 \\ \hline \text { Observations } & 30.0000 \\ \hline \end{array}    \text { ANOVA }    \begin{array}{|l|r|r|r|r|r|} \hline &\text { df } & \text { SS } & \text { MS } & F & \text { Significance } F \\  \hline \text { Regression } & 1 & 171062.9193 & 171062.9193 & 86.4759 & 0.0000 \\ \hline \text { Residual } & 28 & 55388.4309 & 1978.1582 & & \\ \hline \text { Total } & 29 & 226451.3503 & & \\ \hline \end{array}          Simple Linear Regression 12-41   -Referring to Scenario 12-11, the null hypothesis for testing whether there is a linear relationship between revenue and the number of downloads is  There is no linear relationship between revenue and the number of downloads . Simple Linear Regression 12-41  SCENARIO 12-11 A computer software developer would like to use the number of downloads (in thousands) for the trial version of his new shareware to predict the amount of revenue (in thousands of dollars) he can make on the full version of the new shareware.Following is the output from a simple linear regression along with the residual plot and normal probability plot obtained from a data set of 30 different sharewares that he has developed:     \begin{array}{lr} {\text { Regression Statistics }} \\ \hline \text { Multiple R } & 0.8691 \\ \hline \text { R Square } & 0.7554 \\ \hline \text { Adjusted R Square } & 0.7467 \\ \hline \text { Standard Error } & 44.4765 \\ \hline \text { Observations } & 30.0000 \\ \hline \end{array}    \text { ANOVA }    \begin{array}{|l|r|r|r|r|r|} \hline &\text { df } & \text { SS } & \text { MS } & F & \text { Significance } F \\  \hline \text { Regression } & 1 & 171062.9193 & 171062.9193 & 86.4759 & 0.0000 \\ \hline \text { Residual } & 28 & 55388.4309 & 1978.1582 & & \\ \hline \text { Total } & 29 & 226451.3503 & & \\ \hline \end{array}          Simple Linear Regression 12-41   -Referring to Scenario 12-11, the null hypothesis for testing whether there is a linear relationship between revenue and the number of downloads is  There is no linear relationship between revenue and the number of downloads .
-Referring to Scenario 12-11, the null hypothesis for testing whether there is a linear relationship between revenue and the number of downloads is "There is no linear relationship between revenue and the number of downloads".

Understand the dynamics and disruption caused by major e-commerce players in the retail and wholesale sectors.
Identify the principles of e-business and e-commerce, including their differences and security considerations.
Understand the concept of viral marketing and its relation to social media.
Recognize the significance of material types in the e-commerce supply chain.

Definitions:

Neandertals

An extinct species of human that was widely distributed in ice-age Europe between c. 120,000-35,000 years ago, coexisting with early Homo sapiens.

Gracile Australopithecines

One member of the genus Australopithecus possessing a more lightly built chewing apparatus; likely had a diet that included more meat than that of the robust australopithecines.

Human Ancestors

Prehistoric species and genera that are considered predecessors of modern humans in the evolutionary lineage.

Homo Erectus

An extinct species of early human that lived throughout Africa and Eurasia from approximately 2 million to 100,000 years ago.

Related Questions