Examlex

Solved

SCENARIO 12-11
a Computer Software Developer Would Like to Use

question 131

Short Answer

SCENARIO 12-11
A computer software developer would like to use the number of downloads (in thousands) for the trial version of his new shareware to predict the amount of revenue (in thousands of dollars) he can make on the full version of the new shareware.Following is the output from a simple linear regression
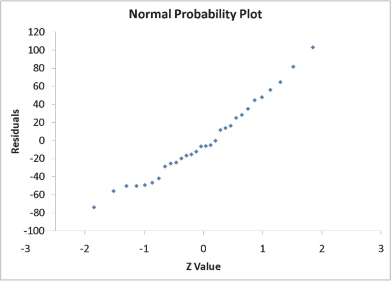
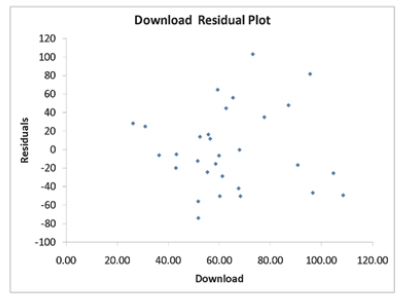
along with the residual plot and normal probability plot obtained from a data set of 30 different sharewares that he has developed:
 SCENARIO 12-11 A computer software developer would like to use the number of downloads (in thousands) for the trial version of his new shareware to predict the amount of revenue (in thousands of dollars) he can make on the full version of the new shareware.Following is the output from a simple linear regression along with the residual plot and normal probability plot obtained from a data set of 30 different sharewares that he has developed:     \begin{array}{lr} {\text { Regression Statistics }} \\ \hline \text { Multiple R } & 0.8691 \\ \hline \text { R Square } & 0.7554 \\ \hline \text { Adjusted R Square } & 0.7467 \\ \hline \text { Standard Error } & 44.4765 \\ \hline \text { Observations } & 30.0000 \\ \hline \end{array}    \text { ANOVA }    \begin{array}{|l|r|r|r|r|r|} \hline &\text { df } & \text { SS } & \text { MS } & F & \text { Significance } F \\  \hline \text { Regression } & 1 & 171062.9193 & 171062.9193 & 86.4759 & 0.0000 \\ \hline \text { Residual } & 28 & 55388.4309 & 1978.1582 & & \\ \hline \text { Total } & 29 & 226451.3503 & & \\ \hline \end{array}          Simple Linear Regression 12-41   -Referring to Scenario 12-11, what is the value of the test statistic for testing whether there is a linear relationship between revenue and the number of downloads?  Regression Statistics  Multiple R 0.8691 R Square 0.7554 Adjusted R Square 0.7467 Standard Error 44.4765 Observations 30.0000\begin{array}{lr}{\text { Regression Statistics }} \\\hline \text { Multiple R } & 0.8691 \\\hline \text { R Square } & 0.7554 \\\hline \text { Adjusted R Square } & 0.7467 \\\hline \text { Standard Error } & 44.4765 \\\hline \text { Observations } & 30.0000 \\\hline\end{array}

 ANOVA \text { ANOVA }
 df  SS  MS F Significance F Regression 1171062.9193171062.919386.47590.0000 Residual 2855388.43091978.1582 Total 29226451.3503\begin{array}{|l|r|r|r|r|r|}\hline &\text { df } & \text { SS } & \text { MS } & F & \text { Significance } F \\ \hline \text { Regression } & 1 & 171062.9193 & 171062.9193 & 86.4759 & 0.0000 \\\hline \text { Residual } & 28 & 55388.4309 & 1978.1582 & & \\\hline \text { Total } & 29 & 226451.3503 & & \\\hline\end{array}


 SCENARIO 12-11 A computer software developer would like to use the number of downloads (in thousands) for the trial version of his new shareware to predict the amount of revenue (in thousands of dollars) he can make on the full version of the new shareware.Following is the output from a simple linear regression along with the residual plot and normal probability plot obtained from a data set of 30 different sharewares that he has developed:     \begin{array}{lr} {\text { Regression Statistics }} \\ \hline \text { Multiple R } & 0.8691 \\ \hline \text { R Square } & 0.7554 \\ \hline \text { Adjusted R Square } & 0.7467 \\ \hline \text { Standard Error } & 44.4765 \\ \hline \text { Observations } & 30.0000 \\ \hline \end{array}    \text { ANOVA }    \begin{array}{|l|r|r|r|r|r|} \hline &\text { df } & \text { SS } & \text { MS } & F & \text { Significance } F \\  \hline \text { Regression } & 1 & 171062.9193 & 171062.9193 & 86.4759 & 0.0000 \\ \hline \text { Residual } & 28 & 55388.4309 & 1978.1582 & & \\ \hline \text { Total } & 29 & 226451.3503 & & \\ \hline \end{array}          Simple Linear Regression 12-41   -Referring to Scenario 12-11, what is the value of the test statistic for testing whether there is a linear relationship between revenue and the number of downloads?

 SCENARIO 12-11 A computer software developer would like to use the number of downloads (in thousands) for the trial version of his new shareware to predict the amount of revenue (in thousands of dollars) he can make on the full version of the new shareware.Following is the output from a simple linear regression along with the residual plot and normal probability plot obtained from a data set of 30 different sharewares that he has developed:     \begin{array}{lr} {\text { Regression Statistics }} \\ \hline \text { Multiple R } & 0.8691 \\ \hline \text { R Square } & 0.7554 \\ \hline \text { Adjusted R Square } & 0.7467 \\ \hline \text { Standard Error } & 44.4765 \\ \hline \text { Observations } & 30.0000 \\ \hline \end{array}    \text { ANOVA }    \begin{array}{|l|r|r|r|r|r|} \hline &\text { df } & \text { SS } & \text { MS } & F & \text { Significance } F \\  \hline \text { Regression } & 1 & 171062.9193 & 171062.9193 & 86.4759 & 0.0000 \\ \hline \text { Residual } & 28 & 55388.4309 & 1978.1582 & & \\ \hline \text { Total } & 29 & 226451.3503 & & \\ \hline \end{array}          Simple Linear Regression 12-41   -Referring to Scenario 12-11, what is the value of the test statistic for testing whether there is a linear relationship between revenue and the number of downloads? Simple Linear Regression 12-41  SCENARIO 12-11 A computer software developer would like to use the number of downloads (in thousands) for the trial version of his new shareware to predict the amount of revenue (in thousands of dollars) he can make on the full version of the new shareware.Following is the output from a simple linear regression along with the residual plot and normal probability plot obtained from a data set of 30 different sharewares that he has developed:     \begin{array}{lr} {\text { Regression Statistics }} \\ \hline \text { Multiple R } & 0.8691 \\ \hline \text { R Square } & 0.7554 \\ \hline \text { Adjusted R Square } & 0.7467 \\ \hline \text { Standard Error } & 44.4765 \\ \hline \text { Observations } & 30.0000 \\ \hline \end{array}    \text { ANOVA }    \begin{array}{|l|r|r|r|r|r|} \hline &\text { df } & \text { SS } & \text { MS } & F & \text { Significance } F \\  \hline \text { Regression } & 1 & 171062.9193 & 171062.9193 & 86.4759 & 0.0000 \\ \hline \text { Residual } & 28 & 55388.4309 & 1978.1582 & & \\ \hline \text { Total } & 29 & 226451.3503 & & \\ \hline \end{array}          Simple Linear Regression 12-41   -Referring to Scenario 12-11, what is the value of the test statistic for testing whether there is a linear relationship between revenue and the number of downloads?
-Referring to Scenario 12-11, what is the value of the test statistic for testing whether there is a linear relationship between revenue and the number of downloads?

Understand the evolving role and expectations of medical assistants in the healthcare sector.
Appreciate the impact of professional organizations in advancing the medical assisting profession.
Understand the continuing education and recertification requirements for various medical assistant certifications.
Comprehend the roles and responsibilities associated with different levels and types of medical assisting duties.

Definitions:

Measure of Variability

A statistic that describes the dispersion of data points in a dataset, such as range, variance, or standard deviation.

Parameter

A quantity that influences the outcome of a mathematical function or statistical operation, often a measure that describes a statistical population.

Measure of Central Tendency

A statistical measure that identifies a single value as representative of an entire distribution.

Parameter

A numerical characteristic or measure that describes an aspect of a population.

Related Questions