Examlex

Solved

SCENARIO 12-11
a Computer Software Developer Would Like to Use

question 131

Short Answer

SCENARIO 12-11
A computer software developer would like to use the number of downloads (in thousands) for the trial version of his new shareware to predict the amount of revenue (in thousands of dollars) he can make on the full version of the new shareware.Following is the output from a simple linear regression
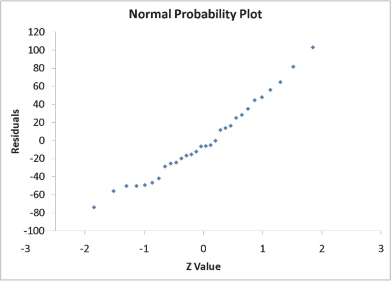
along with the residual plot and normal probability plot obtained from a data set of 30 different sharewares that he has developed:
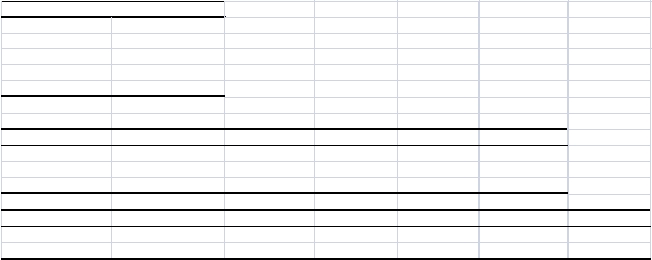
 SCENARIO 12-11 A computer software developer would like to use the number of downloads (in thousands) for the trial version of his new shareware to predict the amount of revenue (in thousands of dollars) he can make on the full version of the new shareware.Following is the output from a simple linear regression along with the residual plot and normal probability plot obtained from a data set of 30 different sharewares that he has developed:     \begin{array}{lr} {\text { Regression Statistics }} \\ \hline \text { Multiple R } & 0.8691 \\ \hline \text { R Square } & 0.7554 \\ \hline \text { Adjusted R Square } & 0.7467 \\ \hline \text { Standard Error } & 44.4765 \\ \hline \text { Observations } & 30.0000 \\ \hline \end{array}    \text { ANOVA }    \begin{array}{|l|r|r|r|r|r|} \hline &\text { df } & \text { SS } & \text { MS } & F & \text { Significance } F \\  \hline \text { Regression } & 1 & 171062.9193 & 171062.9193 & 86.4759 & 0.0000 \\ \hline \text { Residual } & 28 & 55388.4309 & 1978.1582 & & \\ \hline \text { Total } & 29 & 226451.3503 & & \\ \hline \end{array}          Simple Linear Regression 12-41   -Referring to Scenario 12-11, what is the value of the test statistic for testing whether there is a linear relationship between revenue and the number of downloads?  Regression Statistics  Multiple R 0.8691 R Square 0.7554 Adjusted R Square 0.7467 Standard Error 44.4765 Observations 30.0000\begin{array}{lr}{\text { Regression Statistics }} \\\hline \text { Multiple R } & 0.8691 \\\hline \text { R Square } & 0.7554 \\\hline \text { Adjusted R Square } & 0.7467 \\\hline \text { Standard Error } & 44.4765 \\\hline \text { Observations } & 30.0000 \\\hline\end{array}

 ANOVA \text { ANOVA }
 df  SS  MS F Significance F Regression 1171062.9193171062.919386.47590.0000 Residual 2855388.43091978.1582 Total 29226451.3503\begin{array}{|l|r|r|r|r|r|}\hline &\text { df } & \text { SS } & \text { MS } & F & \text { Significance } F \\ \hline \text { Regression } & 1 & 171062.9193 & 171062.9193 & 86.4759 & 0.0000 \\\hline \text { Residual } & 28 & 55388.4309 & 1978.1582 & & \\\hline \text { Total } & 29 & 226451.3503 & & \\\hline\end{array}


 SCENARIO 12-11 A computer software developer would like to use the number of downloads (in thousands) for the trial version of his new shareware to predict the amount of revenue (in thousands of dollars) he can make on the full version of the new shareware.Following is the output from a simple linear regression along with the residual plot and normal probability plot obtained from a data set of 30 different sharewares that he has developed:     \begin{array}{lr} {\text { Regression Statistics }} \\ \hline \text { Multiple R } & 0.8691 \\ \hline \text { R Square } & 0.7554 \\ \hline \text { Adjusted R Square } & 0.7467 \\ \hline \text { Standard Error } & 44.4765 \\ \hline \text { Observations } & 30.0000 \\ \hline \end{array}    \text { ANOVA }    \begin{array}{|l|r|r|r|r|r|} \hline &\text { df } & \text { SS } & \text { MS } & F & \text { Significance } F \\  \hline \text { Regression } & 1 & 171062.9193 & 171062.9193 & 86.4759 & 0.0000 \\ \hline \text { Residual } & 28 & 55388.4309 & 1978.1582 & & \\ \hline \text { Total } & 29 & 226451.3503 & & \\ \hline \end{array}          Simple Linear Regression 12-41   -Referring to Scenario 12-11, what is the value of the test statistic for testing whether there is a linear relationship between revenue and the number of downloads?
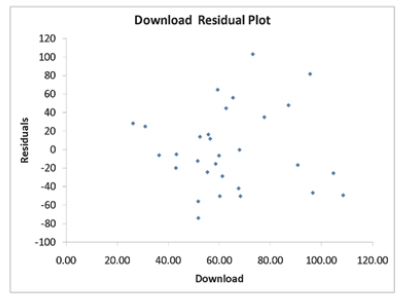

 SCENARIO 12-11 A computer software developer would like to use the number of downloads (in thousands) for the trial version of his new shareware to predict the amount of revenue (in thousands of dollars) he can make on the full version of the new shareware.Following is the output from a simple linear regression along with the residual plot and normal probability plot obtained from a data set of 30 different sharewares that he has developed:     \begin{array}{lr} {\text { Regression Statistics }} \\ \hline \text { Multiple R } & 0.8691 \\ \hline \text { R Square } & 0.7554 \\ \hline \text { Adjusted R Square } & 0.7467 \\ \hline \text { Standard Error } & 44.4765 \\ \hline \text { Observations } & 30.0000 \\ \hline \end{array}    \text { ANOVA }    \begin{array}{|l|r|r|r|r|r|} \hline &\text { df } & \text { SS } & \text { MS } & F & \text { Significance } F \\  \hline \text { Regression } & 1 & 171062.9193 & 171062.9193 & 86.4759 & 0.0000 \\ \hline \text { Residual } & 28 & 55388.4309 & 1978.1582 & & \\ \hline \text { Total } & 29 & 226451.3503 & & \\ \hline \end{array}          Simple Linear Regression 12-41   -Referring to Scenario 12-11, what is the value of the test statistic for testing whether there is a linear relationship between revenue and the number of downloads? Simple Linear Regression 12-41  SCENARIO 12-11 A computer software developer would like to use the number of downloads (in thousands) for the trial version of his new shareware to predict the amount of revenue (in thousands of dollars) he can make on the full version of the new shareware.Following is the output from a simple linear regression along with the residual plot and normal probability plot obtained from a data set of 30 different sharewares that he has developed:     \begin{array}{lr} {\text { Regression Statistics }} \\ \hline \text { Multiple R } & 0.8691 \\ \hline \text { R Square } & 0.7554 \\ \hline \text { Adjusted R Square } & 0.7467 \\ \hline \text { Standard Error } & 44.4765 \\ \hline \text { Observations } & 30.0000 \\ \hline \end{array}    \text { ANOVA }    \begin{array}{|l|r|r|r|r|r|} \hline &\text { df } & \text { SS } & \text { MS } & F & \text { Significance } F \\  \hline \text { Regression } & 1 & 171062.9193 & 171062.9193 & 86.4759 & 0.0000 \\ \hline \text { Residual } & 28 & 55388.4309 & 1978.1582 & & \\ \hline \text { Total } & 29 & 226451.3503 & & \\ \hline \end{array}          Simple Linear Regression 12-41   -Referring to Scenario 12-11, what is the value of the test statistic for testing whether there is a linear relationship between revenue and the number of downloads?
-Referring to Scenario 12-11, what is the value of the test statistic for testing whether there is a linear relationship between revenue and the number of downloads?


Definitions:

Year 2

A reference to the second year of operation, study, or observation, the specifics of which depend on the context.

Current Ratio

An indicator of how well a company can fulfill its short-term financial obligations within a year, calculated by the division of current assets by current liabilities.

Year 2

A reference to the second year of a company's operations, project timeframe, or any specific period's second year.

Operating Cycle

The duration of time it takes for a company to purchase inventory, sell the products, and collect cash from the sales.

Related Questions