SCENARIO 12-11
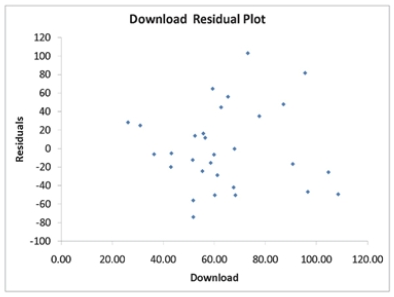
A computer software developer would like to use the number of downloads (in thousands) for the trial version of his new shareware to predict the amount of revenue (in thousands of dollars) he can make on the full version of the new shareware.Following is the output from a simple linear regression
along with the residual plot and normal probability plot obtained from a data set of 30 different sharewares that he has developed:

ANOVA
 Simple Linear Regression 12-41
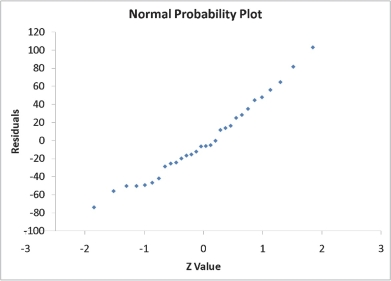
-Referring to Scenario 12-11, which of the following is the correct null hypothesis for testing whether there is a linear relationship between revenue and the number of downloads? a)
b)
c)
d)
Definitions:
Incremental Costs
Costs that change depending on the level of production or an alternative course of action.
Additional Revenues
Extra income generated from sources outside of the company's main business operations.
Sunk Cost
Costs that have already been incurred and cannot be recovered or reversed.
Incremental Overhead Costs
Additional overhead expenses directly resulting from a specific business decision or activity.
Q16: Referring to Scenario 12-10, which test
Q24: Referring to Scenario 12-4, the prediction for
Q37: Referring to Scenario 12-11, which of
Q44: Referring to Scenario 12-5, the null hypothesis
Q51: Referring to SCENARIO 13-17, there is sufficient
Q77: Referring to Scenario 12-5, the standard error
Q94: Splitting is always followed by pruning in
Q112: The prescriptive analytics technique in which the
Q186: Referring to Scenario 12-4, the least squares
Q210: Referring to SCENARIO 13-15, what are the