Examlex

Solved

SCENARIO 12-11
a Computer Software Developer Would Like to Use

question 47

Multiple Choice

SCENARIO 12-11
A computer software developer would like to use the number of downloads (in thousands) for the trial version of his new shareware to predict the amount of revenue (in thousands of dollars) he can make on the full version of the new shareware.Following is the output from a simple linear regression
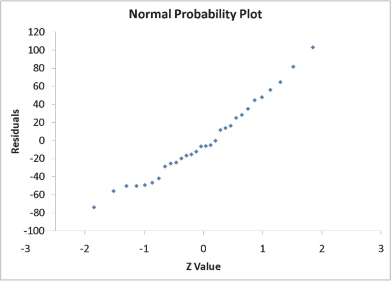
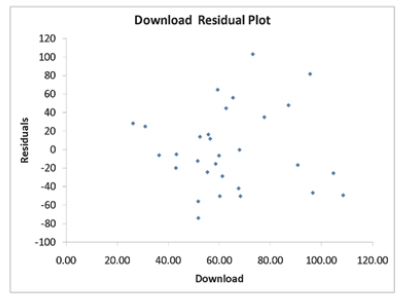
along with the residual plot and normal probability plot obtained from a data set of 30 different sharewares that he has developed:
 SCENARIO 12-11 A computer software developer would like to use the number of downloads (in thousands)  for the trial version of his new shareware to predict the amount of revenue (in thousands of dollars)  he can make on the full version of the new shareware.Following is the output from a simple linear regression along with the residual plot and normal probability plot obtained from a data set of 30 different sharewares that he has developed:     \begin{array}{lr} {\text { Regression Statistics }} \\ \hline \text { Multiple R } & 0.8691 \\ \hline \text { R Square } & 0.7554 \\ \hline \text { Adjusted R Square } & 0.7467 \\ \hline \text { Standard Error } & 44.4765 \\ \hline \text { Observations } & 30.0000 \\ \hline \end{array}    \text { ANOVA }    \begin{array}{|l|r|r|r|r|r|} \hline &\text { df } & \text { SS } & \text { MS } & F & \text { Significance } F \\  \hline \text { Regression } & 1 & 171062.9193 & 171062.9193 & 86.4759 & 0.0000 \\ \hline \text { Residual } & 28 & 55388.4309 & 1978.1582 & & \\ \hline \text { Total } & 29 & 226451.3503 & & \\ \hline \end{array}          Simple Linear Regression 12-41   -Referring to Scenario 12-11, which of the following is the correct interpretation for the coefficient of determination? A) 74.67% of the variation in revenue can be explained by the variation in the number of downloads. B) 75.54% of the variation in revenue can be explained by the variation in the number of downloads. C) 74.67% of the variation in the number of downloads can be explained by the variation in revenue. D) 75.54% of the variation in the number of downloads can be explained by the variation in revenue.  Regression Statistics  Multiple R 0.8691 R Square 0.7554 Adjusted R Square 0.7467 Standard Error 44.4765 Observations 30.0000\begin{array}{lr}{\text { Regression Statistics }} \\\hline \text { Multiple R } & 0.8691 \\\hline \text { R Square } & 0.7554 \\\hline \text { Adjusted R Square } & 0.7467 \\\hline \text { Standard Error } & 44.4765 \\\hline \text { Observations } & 30.0000 \\\hline\end{array}

 ANOVA \text { ANOVA }
 df  SS  MS F Significance F Regression 1171062.9193171062.919386.47590.0000 Residual 2855388.43091978.1582 Total 29226451.3503\begin{array}{|l|r|r|r|r|r|}\hline &\text { df } & \text { SS } & \text { MS } & F & \text { Significance } F \\ \hline \text { Regression } & 1 & 171062.9193 & 171062.9193 & 86.4759 & 0.0000 \\\hline \text { Residual } & 28 & 55388.4309 & 1978.1582 & & \\\hline \text { Total } & 29 & 226451.3503 & & \\\hline\end{array}


 SCENARIO 12-11 A computer software developer would like to use the number of downloads (in thousands)  for the trial version of his new shareware to predict the amount of revenue (in thousands of dollars)  he can make on the full version of the new shareware.Following is the output from a simple linear regression along with the residual plot and normal probability plot obtained from a data set of 30 different sharewares that he has developed:     \begin{array}{lr} {\text { Regression Statistics }} \\ \hline \text { Multiple R } & 0.8691 \\ \hline \text { R Square } & 0.7554 \\ \hline \text { Adjusted R Square } & 0.7467 \\ \hline \text { Standard Error } & 44.4765 \\ \hline \text { Observations } & 30.0000 \\ \hline \end{array}    \text { ANOVA }    \begin{array}{|l|r|r|r|r|r|} \hline &\text { df } & \text { SS } & \text { MS } & F & \text { Significance } F \\  \hline \text { Regression } & 1 & 171062.9193 & 171062.9193 & 86.4759 & 0.0000 \\ \hline \text { Residual } & 28 & 55388.4309 & 1978.1582 & & \\ \hline \text { Total } & 29 & 226451.3503 & & \\ \hline \end{array}          Simple Linear Regression 12-41   -Referring to Scenario 12-11, which of the following is the correct interpretation for the coefficient of determination? A) 74.67% of the variation in revenue can be explained by the variation in the number of downloads. B) 75.54% of the variation in revenue can be explained by the variation in the number of downloads. C) 74.67% of the variation in the number of downloads can be explained by the variation in revenue. D) 75.54% of the variation in the number of downloads can be explained by the variation in revenue.

 SCENARIO 12-11 A computer software developer would like to use the number of downloads (in thousands)  for the trial version of his new shareware to predict the amount of revenue (in thousands of dollars)  he can make on the full version of the new shareware.Following is the output from a simple linear regression along with the residual plot and normal probability plot obtained from a data set of 30 different sharewares that he has developed:     \begin{array}{lr} {\text { Regression Statistics }} \\ \hline \text { Multiple R } & 0.8691 \\ \hline \text { R Square } & 0.7554 \\ \hline \text { Adjusted R Square } & 0.7467 \\ \hline \text { Standard Error } & 44.4765 \\ \hline \text { Observations } & 30.0000 \\ \hline \end{array}    \text { ANOVA }    \begin{array}{|l|r|r|r|r|r|} \hline &\text { df } & \text { SS } & \text { MS } & F & \text { Significance } F \\  \hline \text { Regression } & 1 & 171062.9193 & 171062.9193 & 86.4759 & 0.0000 \\ \hline \text { Residual } & 28 & 55388.4309 & 1978.1582 & & \\ \hline \text { Total } & 29 & 226451.3503 & & \\ \hline \end{array}          Simple Linear Regression 12-41   -Referring to Scenario 12-11, which of the following is the correct interpretation for the coefficient of determination? A) 74.67% of the variation in revenue can be explained by the variation in the number of downloads. B) 75.54% of the variation in revenue can be explained by the variation in the number of downloads. C) 74.67% of the variation in the number of downloads can be explained by the variation in revenue. D) 75.54% of the variation in the number of downloads can be explained by the variation in revenue. Simple Linear Regression 12-41  SCENARIO 12-11 A computer software developer would like to use the number of downloads (in thousands)  for the trial version of his new shareware to predict the amount of revenue (in thousands of dollars)  he can make on the full version of the new shareware.Following is the output from a simple linear regression along with the residual plot and normal probability plot obtained from a data set of 30 different sharewares that he has developed:     \begin{array}{lr} {\text { Regression Statistics }} \\ \hline \text { Multiple R } & 0.8691 \\ \hline \text { R Square } & 0.7554 \\ \hline \text { Adjusted R Square } & 0.7467 \\ \hline \text { Standard Error } & 44.4765 \\ \hline \text { Observations } & 30.0000 \\ \hline \end{array}    \text { ANOVA }    \begin{array}{|l|r|r|r|r|r|} \hline &\text { df } & \text { SS } & \text { MS } & F & \text { Significance } F \\  \hline \text { Regression } & 1 & 171062.9193 & 171062.9193 & 86.4759 & 0.0000 \\ \hline \text { Residual } & 28 & 55388.4309 & 1978.1582 & & \\ \hline \text { Total } & 29 & 226451.3503 & & \\ \hline \end{array}          Simple Linear Regression 12-41   -Referring to Scenario 12-11, which of the following is the correct interpretation for the coefficient of determination? A) 74.67% of the variation in revenue can be explained by the variation in the number of downloads. B) 75.54% of the variation in revenue can be explained by the variation in the number of downloads. C) 74.67% of the variation in the number of downloads can be explained by the variation in revenue. D) 75.54% of the variation in the number of downloads can be explained by the variation in revenue.
-Referring to Scenario 12-11, which of the following is the correct interpretation for the coefficient of determination?


Definitions:

Target Audiences

Specific groups of people a company or organization aims to reach with its products, services, or messages, identified by characteristics like age, gender, income, or interests.

Beyond Likes

An approach in social media marketing that focuses on meaningful engagement and building deep connections with the audience, rather than just accumulating likes.

140-Character Limit

A former specification for the maximum length of a message on Twitter, emphasizing brevity and concise communication on the platform.

Twitter Feed

A real-time stream of tweets on the Twitter platform, displaying posts from users one follows or related to specific topics or hashtags.

Related Questions